If you’ve ever done quality control tracking in Excel, you already know it’s a minefield of filters, formulas, and fragile charts.
You just want to know which product batches are underperforming, which inspectors are catching more defects, and whether your yield rate is trending up or tanking. But in traditional Excel, it’s like reverse-engineering an airplane from a bunch of parts and hoping it flies.
So let's first dive into how complicated yield rate tracking actually is—before I show you the one-line magic Excelmatic brings to the table.
Traditional Excel Method: Functional, But Fatiguing
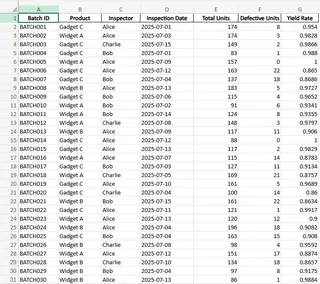
Let’s say you have a table of 30 inspection records. Each row includes batch ID, product type, inspector, inspection date, total units, defective units, and calculated yield.

You want to answer questions like:
- Which product has the lowest average yield rate?
- Which inspector is consistently catching more defects?
- Are we improving over time?
Here’s how the old-school method looks:
Step 1: Build a pivot table. You group by product and calculate the average yield.
Step 2: Add conditional formatting. Highlight batches with yield below 90%.
Step 3: Use AVERAGEIFS. Manually build formulas to filter yield by product or inspector.
Step 4: Trend tracking. Create a separate line chart filtered by time and product.
Step 5: Error hunting. Every tweak breaks a range, every update requires refreshing charts, and you’re back to dragging things cell by cell.
Worse, all this is just to “see” what’s going on. Not even to fix it.
Excelmatic: One Sentence, Total Clarity
Now imagine uploading that same yield data file to Excelmatic and asking:
Which product has the lowest average yield rate?

Want to spot inspector patterns?
Show a chart comparing yield rate by inspector.
Bam. You get a clean, labeled Bar Chart showing who's catching what—and how consistent they are.
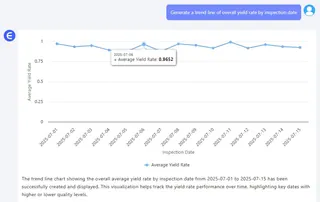
Want to monitor batch quality over time?
Generate a trend line of overall yield rate by inspection date.

Again, it’s just there. Clear and simple, without any elbow grease.
Example Questions You Can Ask Excelmatic
“Which product has the lowest average yield rate?”
“Show a chart comparing yield rate by inspector.”
“Generate a trend line of overall yield rate by inspection date.”
These questions take less than a minute. Excelmatic handles the structure, the math, and the visual—all you do is ask.
Manual Excel vs Excelmatic: Time is Quality
| Task | Traditional Excel | Excelmatic |
|---|---|---|
| Calculate product yield average | AVERAGEIFS + helper columns |
Ask: "Average yield by product?" |
| Spot low-yield batches | Conditional formatting rules | Ask: "Which batches are below 90% yield?" |
| Inspector comparison | Manual charting or pivot slicing | Ask: "Compare inspectors by yield rate" |
The real difference isn’t just time saved. It’s insight unlocked. With Excelmatic, anyone on your team—quality, ops, or even finance—can explore production performance with zero training.
Final Thoughts: Why You Don’t Need to Be an Excel Wizard
Quality data deserves better than a broken spreadsheet. You don’t need to be a formula genius to understand what’s going on in your factory floor. With Excelmatic, you just need to ask.
So next time you're staring at 200 rows of defect data thinking “Where do I even begin?” ——— Just upload the file.And type your question.
Ready to try it yourself?Try Excelmatic now >>


