Tracking employee attendance is one of the most detail-heavy and error-prone responsibilities in HR. Whether it’s calculating attendance rates, spotting latecomers, or summarizing data by department, Excel-based methods often require complex formulas and repetitive manual work.
In this post, we’ll explore three common attendance analysis problems HR teams face—and show you how to solve them effortlessly with Excelmatic, a tool that turns natural-language questions into clean, automated Excel analysis.
The Problem with Traditional Excel-Based Attendance Tracking
Imagine you have a typical attendance log like this:
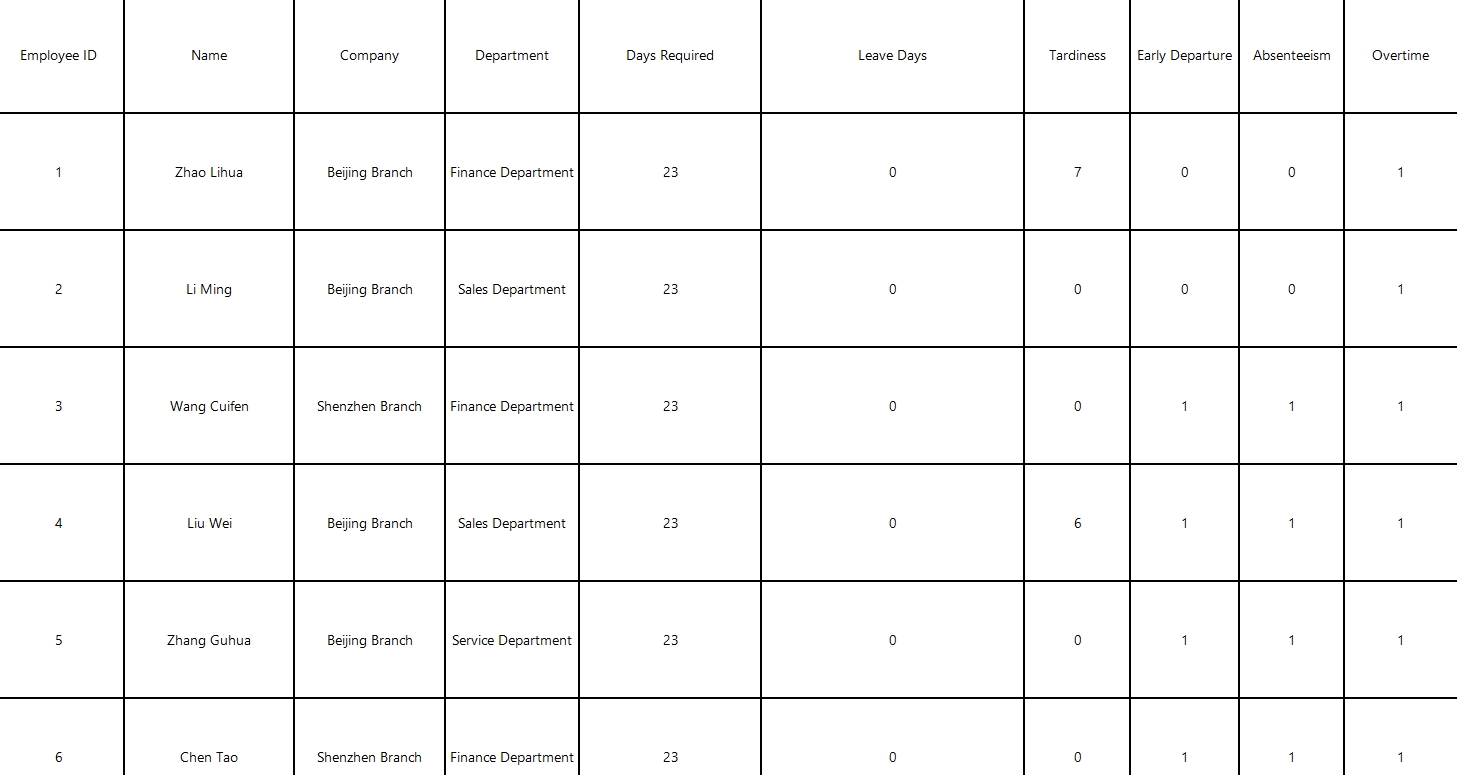
Now imagine needing to:
- Calculate attendance rate for each employee
- Identify who’s late most often
- Summarize overall department-level performance
Doing this manually means:
- Writing multiple
COUNTIForIFformulas - Building and maintaining pivot tables
- Filtering across months and columns repeatedly
It’s time-consuming and error-prone—even for Excel-savvy HR professionals.
Excelmatic to the Rescue: 3 Smart Questions = Instant Results
With Excelmatic, you can upload your attendance file and ask direct, human-style questions. No formulas. No pivot tables. Just clean answers.
Let’s walk through each problem and how to solve it:
Problem 1: How to calculate attendance rate for each employee?
Excelmatic Question: Please calculate each employee’s attendance days in April, and determine attendance rate (attendance days / working days). Late or absent counts as non-full attendance.
Result: Excelmatic automatically:
- Computes attendance rate as a percentage
- Returns a table sorted by employee, with clear rates
Problem 2: Who has the most frequent lateness or early leaves?
Excelmatic Question: Please summarize late and early leave counts per employee, and list the top 10 offenders.
Result: Excelmatic:
- Tallies
Late = YesandEarly Leave = Yesrows - Ranks employees by total count
- Produces a top-10 list for internal reference or alerts
No need to use filters or build a leaderboard manually.
Problem 3: How is each department performing overall?
Excelmatic Question: Please group by ‘Department’, calculate average attendance rate and total absence days, and generate a Bar Chart.
Result:
- Groups data by
Department - Computes average attendance rates and sums total absences
- Generates a clean Bar Chart for quick reporting
This saves hours compared to traditional summary tables + chart building.
Conclusion: Attendance Analysis Without the Excel Stress
Managing attendance shouldn’t mean managing formulas. With Excelmatic’s Excel analysis capabilities, HR teams can go from raw check-in data to strategic insights in minutes. No formulas, no errors—just clean results driven by smart questions.
Ready to experience it yourself? Click here to see the full prompt flow and try the tool >>