If you’ve ever had to manage a production schedule in Excel, you know it’s like a never-ending game of Tetris—shifting jobs, juggling capacities, and praying that nothing breaks. You think you’ve cracked it, and then a last-minute order, a delayed delivery, or a machine breakdown ruins everything.
For most manufacturing teams, production planning is still a manual Excel dance—filtering by date, counting machine hours, matching inventory levels, color-coding overlaps, writing formulas to flag clashes… until the spreadsheet looks like a modern art piece.
And all you wanted to know was: Are we overbooked next week? Who’s idle? Can we fit in this rush order without breaking the flow?
Let’s walk through the pain first—and then I’ll show you how Excelmatic turns it into a one-sentence magic trick.
Traditional Excel Method: Exhausting but Familiar
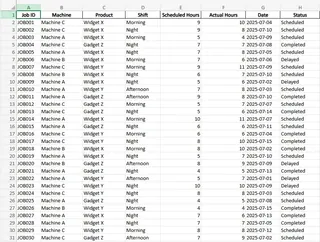
Let’s say you have a table of 30 production jobs—each with start dates, durations, assigned machines, and status. You want to see which machines are overloaded and which have slack in the upcoming week.

Here’s how you’d normally handle it:
Step 1: Create a time axis. Insert a row of days or weeks to match the production window.
Step 2: Build a Gantt-style chart. Use conditional formatting, helper columns, or
=IF(AND(...))formulas to flag job assignments by day and by machine.Step 3: Count usage. Use
COUNTIForSUMPRODUCTto tally how many jobs hit each machine each day.Step 4: Flag conflicts. Highlight any cells where total load exceeds machine capacity (e.g., more than 1 job per time block).
Step 5: Reassign manually. When clashes appear, you try switching machines, adjusting dates, or squeezing jobs into narrow windows.
It works. But it’s fragile. One wrong drag-and-drop, and your formulas break. You’ll spend more time fixing formatting than making decisions.
Sample Questions Excelmatic Can Answer Instantly
With Excelmatic, you can drop your production schedule sheet in, type your question in plain English, and get smart, clear answers. No formulas. No charts to build.
Here are three questions you could ask right away:
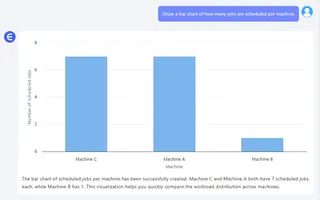
Show a Bar Chart of how many jobs are scheduled per machine.

Instantly visualize workload balance and spot bottlenecks.
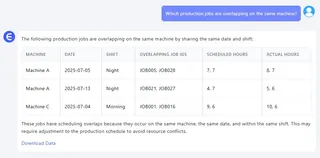
Which production jobs are overlapping on the same machine?

Detect scheduling conflicts without needing to scroll through colored cells.
Which machines are idle for more than 2 days this week?

Find opportunities to optimize capacity and boost utilization.
And you can ask these as naturally as you’d speak to a colleague.
Excelmatic vs. Manual Excel: The Real Difference
The traditional way gets you results—eventually. But it comes with friction:
- Setup takes time
- Adjustments break things
- Collaboration is painful
- Visualizing requires hacks
Excelmatic skips all that. You focus on what you need to know, not how to extract it.
Instead of ten steps, it’s just:
Which machines are over capacity this week?
Done. Chart generated. Answer ready.
So, What’s Next?
If you’re tired of treating Excel like a maze just to answer simple scheduling questions, give Excelmatic a try. You’ll spend less time formatting and more time fine-tuning your flow.
Production teams should be focused on making things, not making spreadsheets work.


