We’ve all been there: staring at Excel, trying to add a percentage to absolute values while avoiding formula disasters. Whether you’re adjusting sales forecasts or analyzing financial data, mixing percentages with absolute functions can feel like solving a Rubik’s Cube blindfolded.
Good news—it’s way easier than you think. Here’s a no-fluff guide to nailing this Excel trick. And if you’d rather skip the manual work, we’ll show how Excelmatic (our AI-powered spreadsheet tool) automates this in seconds.
Why ABS + Percentages Matter
The ABS function strips negative signs from numbers, giving you clean positive values. Combine it with percentages, and you unlock:
- Consistent financial reports (e.g., showing revenue growth regardless of profit/loss)
- Accurate scientific data (comparing magnitude changes without sign distortions)
- Simplified dashboards where trends matter more than directional noise
Step-by-Step: Add a Percentage to Absolute Values
- Set up your data: Column A has values (e.g.,
-100,50,-200). - Apply the formula: In Column B, enter:
=ABS(A1)*(1+[Percentage])[Percentage]with your decimal (e.g.,0.05for 5%). - Drag to fill: Copy the formula down the column.
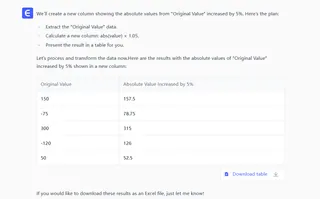
Example: Increasing values by 5%:
| Original | Adjusted (ABS +5%) |
|---|---|
| -100 | 105 |
| 50 | 52.5 |
Pro Tips to Avoid Mistakes
- Use cell references for dynamic percentages (e.g.,
=ABS(A1)*(1+$B$1)where B1 holds your %). - Format as %: Right-click cells > Format Cells > Percentage to display decimals cleanly.
- Double-check negatives: ABS ensures consistency, but verify calculations if inputs change.
Let AI Do the Work: Excelmatic’s Shortcut
Manually writing formulas? That’s so 2023. With Excelmatic, you can:
✅ Auto-generate formulas (just describe what you need, like “increase absolute values by 5%”)
✅ Build error-proof dashboards with AI handling complex math
✅ Update data in real-time without formula tweaks
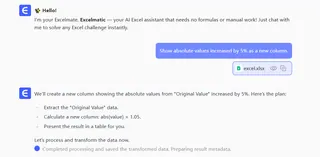
Example: Upload your spreadsheet to Excelmatic, and prompt:
“Show absolute values increased by 5% as a new column.”


Done—no coding, no errors.
When to Use This Trick
- Budget adjustments: Apply uniform % changes to expenses (positive or negative).
- Performance metrics: Compare growth rates fairly across departments.
- Scientific modeling: Normalize data magnitudes for clearer trends.
Tired of Excel Formulas? Try AI
Excelmatic transforms spreadsheets from frustrating to frictionless. Instead of memorizing functions, you get:
- One-click insights (AI analyzes data and suggests optimizations)
- Plain-language commands (e.g., “Make all values positive and add 10%”)
- Shareable reports with auto-generated charts
Try it free: Excelmatic.com
Final Thought
Mastering ABS + percentages is useful—but why waste time on manual work? Tools like Excelmatic let you focus on decisions instead of data wrangling. Next time you’re stuck in formula hell, remember: AI’s got your back.
Need more Excel hacks? Check out our guide on AI-powered data analysis.


