Excel AI Resources
Guides, templates, and Excel AI workflows to get work done faster.
 Data Visualization
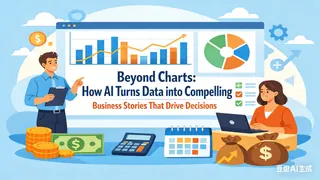
Beyond Charts: How AI Turns Data into Compelling Business Stories That Drive Decisions
Move beyond basic charts. Discover how Excelmatic's AI understands business context to create visual narratives that highlight trends, pinpoint issues, and suggest opportunities.
Ruby • Data Visualization
From Data to Insight: How AI Reduces Chart Creation Time from 3 Hours to 30 Seconds
The days of manual chart adjustments are over. With Excelmatic, a simple instruction is all you need to generate professional charts for reports, presentations, and dashboards—from data to visualization in just 30 seconds.
Ruby • Data Cleaning
Dirty Data is a Career Killer. Here’s Your 60-Second Recovery Plan.
Stop being a data janitor. In 2026, manual spreadsheet cleaning is a choice, not a necessity. Learn how Excelmatic uses semantic AI to transform 'garbage data' into boardroom-ready insights instantly.
Ruby • Excel Tips
The Death of the 'Excel Night Shift': How AI Reclaims 10 Hours of Your Weekend.
The era of late-night data cleaning is over. Learn how Excelmatic's AI turns grueling manual work into a 30-second conversation, so you can spend your weekend on what actually matters.
Ruby • Excel Tips
Stop Merging Excel Files Manually. Do It with One Sentence Instead.
Still manually consolidating reports or wrestling with Power Query? Discover how Excelmatic's AI transforms messy data merging into a simple conversation—saving you hours of tedious work.
Ruby • Excel Tips
Stop Manually Splitting Cells in Excel. Do It with One Sentence Instead.
Tired of manually separating names, addresses, or codes in Excel? Discover how Excelmatic's AI transforms this tedious task into a simple conversation—saving you hours and eliminating formula headaches.
Ruby •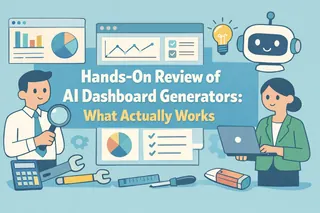 AI Dashboard
Hands-On Review of AI Dashboard Generators: What Actually Works
A practical, hands-on evaluation of AI dashboard generators, focusing on how they interpret natural language, infer data structure, and perform in real workflows.
Gogo •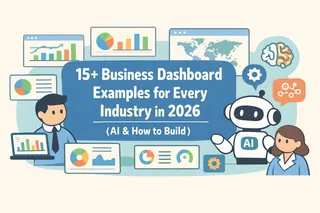 AI Dashboard
15+ Business Dashboard Examples for Every Industry in 2026 (AI & How to Build)
Explore 15+ business dashboard examples and learn how to build your own with AI-powered tools like Excelmatic.
Gogo •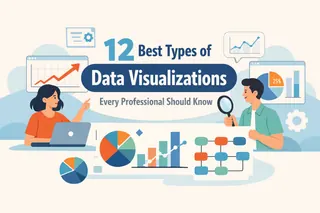 Data Visualization
12 Best Types of Data Visualizations Every Professional Should Know
Explore 12 essential data visualization types and see how Excelmatic makes creating charts and dashboards fast and effortless.
Gogo • AI Dashboard
How to Create AI Dashboards Quickly and Easily: Step-by-Step Guide
Learn how AI automates data analysis and dashboard creation. Step-by-step guide to transform raw data into actionable insights.
Gogo • AI Dashboard
What is a Tactical Dashboard? (Example & How to Build with Excelmatic)
A tactical dashboard supports daily execution through short-term, actionable metrics, built faster with Excelmatic AI.
Gogo • AI Dashboard
How to Build Excel Dashboards: From Manual Steps to Excelmatic
Master Excel dashboards from manual setup to automated insights with Excelmatic. Save time and visualize your data clearly.
Gogo • AI Dashboard
Predictive Dashboards That Transform Your Business Decisions
Predictive dashboards in Excelmatic help teams forecast trends, anticipate outcomes, and turn data into actionable business insights quickly and easily.
Gogo • AI Dashboard
The 3 Core Types of Dashboards Explained: Operational vs Strategic vs Analytical
This guide explains the three core dashboard types and how AI tools help teams choose — and build — the right one faster.
Gogo • AI Dashboard
Analytical Dashboards Explained: What They Are and How to Build
Discover how to create analytical dashboards with Excelmatic, turning spreadsheets into AI-powered insights in minutes.
Gogo • AI Dashboard
No-Code Dashboard Tools in 2026: How Teams Turn Data into Decisions Faster
A practical guide to no-code dashboard tools and how teams use AI to turn everyday data into faster decisions.
Gogo • AI Dashboard
How to Build a Project Tracking Dashboard with Excelmatic AI
Build a real-time AI-powered Excelmatic dashboard to track projects, visualize KPIs, and make informed management decisions.
Gogo • AI Dashboard
Customer Retention Dashboard Example for SaaS Teams (Metrics & Structure)
Use a Customer Retention Dashboard to track SaaS users, reduce churn, and grow revenue.
Gogo • AI Dashboard
Business Forecast Dashboard: 5 Examples for SMBs
Explore business forecast dashboard examples that help SMBs gain clarity, improve budgeting, and plan with confidence.
Gogo • AI Dashboard
AI Marketing Attribution Dashboards: How to Stop Guessing Which Ads Actually Convert
How AI marketing attribution dashboards help Shopify brands identify which ads actually convert and where ad spend is wasted.
Gogo • AI Dashboard
5 Analytical Dashboard Types Operations Teams Rely On
The analytical dashboard types operations teams use most, and how Excelmatic fits into real Excel-based decision workflows.
Gogo • AI Dashboard
Operations Dashboard Examples for Businesses That Need Faster Decisions
A practical guide to operations dashboard examples for businesses, covering use cases, best practices, and execution-focused design.
Gogo • AI Dashboard
Strategic Dashboard: A Practical Guide with 5 Real-World Examples
This guide explains strategic dashboards, core layers, real use cases, and how leaders turn data into strategy.
Gogo • AI Dashboard
The 5 Pillars of a Strategic Dashboard for Better Decisions
This article explains the five pillars that turn dashboards into decision systems.
Gogo • Excel Tips
Still Struggling with Excel? Why AI is the Skill Upgrade You Really Need
Everyone says you need Excel skills, but nobody talks about the frustrating learning curve and hours spent on manual tasks. What if you could skip the complex formulas and just ask your spreadsheet for answers? Discover how Excel AI is changing the game.
Ruby • AI Dashboard
Excel to Dashboard: How AI Visualizes Data Without Pivot Tables
Learn how AI transforms Excel files into dashboards without formulas, pivots, or manual formatting.
Gogo • AI Dashboard
Performance Dashboard: What It Is, Types, and Best Practices
A performance dashboard connects fragmented business metrics into a clear view that supports faster, better decision-making.
Gogo • AI Dashboard
5 Retail Dashboard Examples Every Team Should Use (How They Are Built)
Five practical retail dashboard examples that help teams connect performance data with better decisions.
Gogo • Excel Tips
Stop Learning Complex Formulas: How Excel AI Unlocks Career Growth
Tired of the weekly grind of building sales reports in Excel? You're not alone. We'll show you how to ditch the tedious SUMIFS and manual pivot table setups and use Excel AI to get insights in minutes, freeing you up for strategic work that gets you noticed.
Ruby • Excel Tips
Your Excel Data Is in the Wrong Format? How to Unpivot It for Analysis (The Easy Way)
Struggling with wide, pivot-style reports that are impossible to analyze? We'll show you how to transform messy data into a clean, usable format—first with Power Query, and then see how an Excel AI agent like Excelmatic can do it in seconds with a simple sentence.
Ruby • AI Dashboard
What Is a Logistics Dashboard? Types, Metrics, and AI Insights
An expert overview of logistics dashboards, their types, key metrics, and the role of AI in logistics decisions.
Gogo • Excel AI
Tired of Learning Endless Excel Tricks? Master Your Data with AI Instead
Feeling overwhelmed by the sheer number of Excel features you're 'supposed' to know? From PivotTables to VBA, the learning curve is steep. What if you could skip the manual steps and just ask for what you need? This guide shows you how.
Ruby • AI Dashboard
What Is a Supply Chain Dashboard? Types, Metrics, and AI-Driven Insights
An expert overview of supply chain dashboards, their types, key metrics, and how AI supports better decisions.
Gogo • Excel Automation
Stop Drowning in Formulas: Master In-Demand Excel Skills with AI
Tired of spending hours building reports and debugging formulas? What if you could just *ask* your spreadsheet for the answers? Learn how Excel AI is revolutionizing data analysis, turning complex tasks like creating Pivot Tables and VLOOKUPs into simple conversations.
Ruby • Excel Tips
Stop Wrestling with Excel Dynamic Array Formulas: Here’s How AI Can Do It for You
Excel's dynamic arrays were a game-changer, but nesting functions like SORT and FILTER is still a headache. Discover how Excelmatic, an AI agent, lets you perform complex data filtering, sorting, and analysis just by asking questions in plain language.
Ruby • Excel Tips
Tired of Messy Excel Tables? Unpivot Your Data in Seconds with AI
Struggling with 'wide' Excel tables where months or categories are in columns? This layout makes filtering and analysis a nightmare. Discover how to unpivot your data from a clunky manual process to a simple conversation with Excel AI.
Ruby •
