For HR professionals, payroll management is one of the most repetitive and error-prone tasks. Traditional Excel operations often require manual formulas and tedious aggregation. This article focuses on two common challenges in HR salary work, and shows how to solve them effortlessly using Excelmatic, a tool designed to simplify Excel analysis for real-world tasks.
Two Common Payroll Challenges in HR Work
1. Salary formulas are error-prone due to too many components
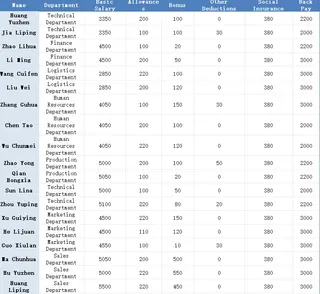
Employee salaries often consist of multiple components such as basic pay, bonuses, subsidies, social security, housing fund, and deductions. With changing policies and individual arrangements, writing consistent, reusable formulas becomes difficult.
2. Department-level salary summaries are time-consuming
Monthly reporting typically requires aggregating total salary, headcount, and average pay per department. Without automation, this involves repetitive SUMIF, COUNTIF, or pivot tables—time-consuming and error-prone.
Example Scenario: A Typical Salary Sheet

Your goals:
- Automatically calculate Gross Pay and Net Pay
- Group salaries by department and summarize totals
- Create charts for internal reports or presentations
Traditional Excel approach:
- Write formulas like
=SUM(...) - Deductions - Use nested
SUMIFSto group by department - Manually build charts each month
Excelmatic Solution: From Hours to Seconds
Step 1: Upload Your Salary File
Start by uploading your employee salary sheet into Excelmatic. No need to change the column names.

Step 2: Ask Questions in Plain English
Use natural language prompts, such as:
- For salary calculation:
Please help me to automatically calculate the payable salary and actual salary based on the table of basic salary, subsidies, bonuses, deductions, social security, retroactive salary.
- For department-level reports:
Please summarize the total actual salary, number of employees, and average salary payable for each department, categorized by department, and generate a chart.
Step 3: Download Your Ready-to-Use Analysis
In just a few seconds, Excelmatic returns:
- A completed salary sheet with calculated Gross and Net Pay
- A department-level summary table
- Auto-generated charts for salary distribution and comparisons
All without writing a single formula or setting up a pivot table.
Conclusion: Excel Analysis Without the Headache
By leveraging Excelmatic’s Excel analysis engine, HR professionals can turn tedious salary sheets into automated workflows. No more errors, no more complex formulas, just clean insights.
👉 Want to see the full step-by-step prompt flow in action? Click here to view the complete demo: Excelmatic Payroll Use Case – Full Walkthrough >>


