如何在 Google 試算表中加入度數符號(5 種簡單方法)

我們都經歷過這樣的時刻——盯著電子表格,試圖在溫度讀數旁邊加上完美的小°符號。作為Excelmatic每日分析成長指標的專家,我可以告訴你,專業報告中正確的數據格式至關重要。

以下是五種在Google Sheets中添加度數符號的可靠方法,從最簡單到最高級排序:

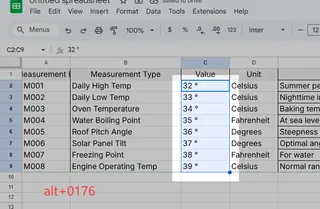
1. 快速鍵盤快捷鍵

Windows用戶:

  • 點擊目標儲存格
  • 按住Alt鍵並輸入0176(使用數字鍵盤)
  • 放開即可看到°符號出現

alt

Mac用戶有更簡單的組合:

  • 只需按下Option + Shift + 8

專業提示:這些快捷鍵在大多數應用程式中都適用——是個實用技巧!

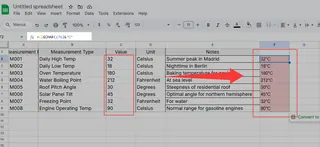
2. CHAR函數(我的最愛)

在Excelmatic,我們熱愛自動化。這個方法可以動態插入°符號:

=CHAR(176)  

更棒的是,可以與其他數據結合:

=C2&CHAR(176)&"C"  

這會自動格式化為「32°C」——儀表板的完美選擇!
gs

3. 自訂數字格式

適用於整齊的溫度欄位:

  1. 選擇儲存格
  2. 前往格式 > 數字 > 自訂數字格式
  3. 輸入:0°

現在輸入的每個數字都會自動加上度數符號——無需公式!

4. 複製貼上救星

有時候簡單最好:

  1. 複製這個:°
  2. 貼到你的表格中

額外技巧:將常用符號儲存在「速查表」分頁中以便快速取用。

5. 手機解決方案

用手機操作?

  1. 點擊?123鍵
  2. 長按0找到°符號

提升你的數據處理能力

雖然這些技巧解決了眼前的問題,但想像一下使用像Excelmatic這樣的AI工具,能自動格式化並視覺化你的數據。我們的平台能將原始數字轉化為精美的報告,每次都完美呈現符號——無需手動調整。

下次當你與表格符號搏鬥時,記住:無論選擇快速快捷鍵還是自動化解決方案,關鍵在於找到適合你工作流程的方法。祝數據處理愉快!

關於作者:作為Excelmatic的成長經理,我致力於將混亂的數據轉化為可行的見解。當我不在優化儀表板時,你會發現我熱衷於讓電子表格更聰明的新方法。

想自動化更多而不只是度數符號嗎?免費試用Excelmatic,讓AI解決你的數據格式煩惱。

AI賦能數據,決策勝券在握!

無需寫代碼與函數,簡單對話讓匡優Excel自動處理數據、生成圖表。立即免費體驗,感受AI如何顛覆你的Excel工作流 →

立即免費體驗

推薦文章

如何在 Google 試算表中新增儲存格(輕鬆無痛)
Excel 操作

如何在 Google 試算表中新增儲存格(輕鬆無痛)

Spreadsheets grow faster than your to-do list. Here’s your stress-free guide to expanding Google Sheets without breaking formulas or losing sanity—with pro tips for AI-powered efficiency.

Gianna
如何在 Google 試算表中新增 X 軸(讓數據更出色)
Excel 操作

如何在 Google 試算表中新增 X 軸(讓數據更出色)

Mastering the X-axis in Google Sheets transforms raw numbers into clear visual stories. Here's your step-by-step guide to creating charts that communicate effectively.

Gianna
如何在 Google 試算表中用 AI 輕鬆加入水平線
Excel 操作

如何在 Google 試算表中用 AI 輕鬆加入水平線

Tired of manually formatting spreadsheets? Discover how AI tools like Excelmatic can automatically add horizontal lines to organize your Google Sheets data in seconds.

Gianna
如何在 Google 試算表中為圖表添加替代文字
Excel 操作

如何在 Google 試算表中為圖表添加替代文字

Adding alt text to charts in Google Sheets isn’t just about accessibility—it’s about making your data understandable to everyone. Here’s how to do it right.

Gianna
如何在 Google 試算表中為長條圖添加資料標籤(逐步指南)
Excel 操作

如何在 Google 試算表中為長條圖添加資料標籤(逐步指南)

Want to make your Google Sheets bar graphs instantly clearer? Adding data labels is the secret sauce for professional-looking charts. Here's exactly how to do it in minutes.

Gianna
如何在 Google 試算表中添加空格以提升資料可讀性
Excel 操作

如何在 Google 試算表中添加空格以提升資料可讀性

Struggling with cramped data in Google Sheets? Discover how to add spaces between text, numbers, and rows to transform messy spreadsheets into clean, professional reports.

Gianna