Scatter Chart Maker
No description yet
 Data Visualization
Is Your Marketing Spend Working? Find Clarity in 5 Minutes with One Scatter Plot
Don't just guess if your marketing spend is driving sales. This guide shows how to move beyond confusing Excel charts and use AI to create a scatter plot that gives you a clear, data-backed answer—including a simple explanation of what the numbers actually mean.
Gianna • Data Visualization
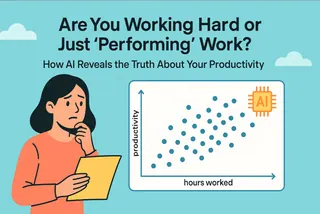
Are You Working Hard or Just 'Performing' Work? How AI Reveals the Truth About Your Productivity
Stop equating long hours with high value. This guide walks you through using an AI tool like Excelmatic to turn a simple work log into a powerful personal productivity report.
Gianna • Data Visualization
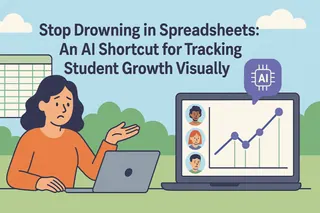
Stop Drowning in Spreadsheets: An AI Shortcut for Tracking Student Growth Visually
The days of manually filtering and charting student data for hours are over. This guide reveals a simple AI shortcut that transforms your master grade sheet into beautiful, individual progress curves with a single command. Free up your time and lead every parent-teacher conference with clear, visual evidence of student growth.
Gianna • Data Visualization
Does More Homework Time Equal Better Grades? Test Your Teaching Intuition with AI
As a teacher, you sense that more homework time doesn't always lead to better grades, but how do you prove it? This guide shows you how to use AI tools like Excelmatic to easily analyze the relationship between homework time and exam scores with a scatter plot. Turn your intuition into data-backed evidence without learning complex Excel functions.
Gianna • Data Visualization
Data Over 'Gut Feeling': Easily Prove Your Business Hunches with an AI Scatter Plot
Your gut feeling is a great start, but data makes it a fact. Learn how to skip the complicated steps in Excel and use AI to instantly create a scatter plot with a trendline. It's time to turn your data into a convincing story.
Gianna •
