Marketing
No description yet
 Data Analysis
How to Start Predictive Modeling: A 5-Step Business Framework (With Examples)
This guide provides business leaders with a clear 5-step framework to start predictive modeling. Learn key concepts, explore practical models like regression and decision trees, and see industry applications through actionable examples to turn data into strategy.
Gogo • Data Analytics
AI Data Analysis for Marketing: Turn Excel Data into Your Competitive Edge
This guide dives into AI data analysis for marketing, showcasing how tools like Excelmatic turn raw Excel data into strategic advantages. From sentiment analysis to predictive modeling, learn how AI uncovers customer insights and drives data-driven decisions—directly from your browser.
Gogo • AI for Statistics
Statistics AI Solver: Fast and Simple Solutions for Business Data Problems
Stop wrestling with complicated spreadsheets. A Statistics AI Solver empowers you to get instant answers from your business data using simple English commands.
Ruby • AI for Statistics
Simplify Statistics with AI: Best Stats AI Calculator & Math Solver
Tired of wrestling with spreadsheets? Discover how a stats AI calculator can become your personal math solver for statistics, turning raw data into decisions.
Ruby • Image To Excel Converter
Image to Excel Converter: The AI Tool to End Manual Data Entry
This guide explores how an AI-powered Image to Excel converter is revolutionizing data workflows. Unlike basic OCR, these tools understand table structures to accurately turn any image into an editable spreadsheet, ending tedious manual data entry for good.
Gianna • Data Visualization
Need a Pie Chart? Stop Manually Filtering and Summing Data.
Making a pie chart in Excel often means tedious filtering and pivot tables. This guide shows how Excelmatic’s AI pie graph maker simplifies this. Turn complex requests into a single sentence and get instant, presentation-ready visuals.
Gianna • Data Analytics
Is Your Chart Just a Pretty Picture? How Excelmatic's AI Analyzes Trends for You
Your line chart looks great, but what does it really mean? When asked for the exact growth rate or next quarter's forecast, most people freeze. This article shows how Excelmatic's AI acts as your personal data analyst, answering those tough questions for you. Learn to turn your static charts into dynamic insights with a single command.
Gianna • Data Visualization
Ditch the Chart Factory: Master Multi-Dimensional Sales Analysis with One Chart
Tired of making endless charts in Excel to compare sales performance? This guide shows how to use a single AI command to generate one multi-line graph that reveals the complete picture. Turn complex data into clear, strategic insight.
Gianna • Data Visualization
From Gut-Feel to Data-Driven: Master Your Sales Forecast in 5 Minutes
Stop relying on gut-feel for your sales targets. This guide shows you how to escape the slow, manual process of Excel forecasting and use AI to turn raw data into a dynamic forecast line graph with just a few simple commands.
Gianna • Data Visualization
How to Create a Sales Performance Bar Chart from Excel Data in Seconds
See how an AI-powered tool replaces the tedious, multi-step process of creating bar charts in Excel. Learn to generate a sorted sales performance leaderboard from raw data using just one natural language command.
Gianna •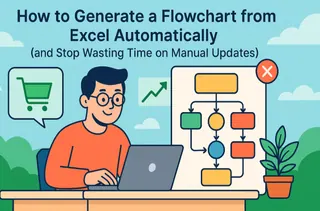 Data Visualization
How to Generate a Flowchart from Excel Automatically (and Stop Wasting Time on Manual Updates)
Is your team still wasting hours manually redrawing process diagrams every time a rule changes? This step-by-step guide walks you through a smarter workflow. Learn how to use a simple Excel file as the single source of truth for your SOPs, and let an AI instantly translate it into a polished, up-to-date flowchart. Free up your team for more valuable work.
Gianna • Data Visualization
Data Insight: Is Your 'Hustle Culture' Silently Killing Innovation?
As a leader, you see execution soaring while innovation stalls. The problem is disconnected data. Learn how Excelmatic merges HR and product metrics, turning your strategic intuition into powerful visual evidence and driving smarter, sustainable growth.
Gianna •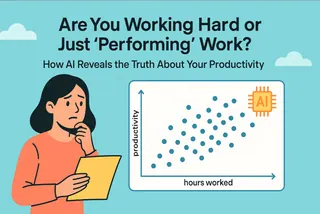 Data Visualization
Are You Working Hard or Just 'Performing' Work? How AI Reveals the Truth About Your Productivity
Stop equating long hours with high value. This guide walks you through using an AI tool like Excelmatic to turn a simple work log into a powerful personal productivity report.
Gianna •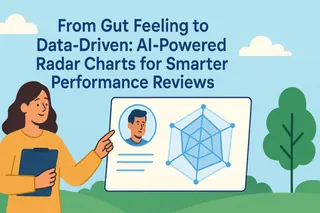 Data Visualization
From Gut Feeling to Data-Driven: AI-Powered Radar Charts for Smarter Performance Reviews
Subjective feedback can hurt team morale. While radar charts provide a clear, objective view of employee skills, creating them manually in Excel is a nightmare for most managers.Learn how to upload your team's ratings and generate a professional competency map with a single command, making your next performance review the most effective one yet.
Gianna •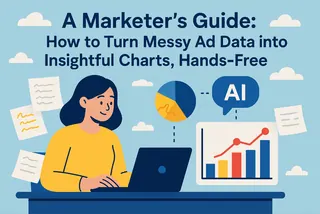 Top AI Tools
A Marketer's Guide: How to Turn Messy Ad Data into Insightful Charts, Hands-Free
Stop wasting hours on manual marketing reports. This guide shows you how modern AI tools can automatically merge files, calculate metrics, and generate presentation-ready charts from a few simple prompts, freeing you up to focus on strategy, not spreadsheets.
Gianna •
