Line Chart
No description yet
 Data Visualization
Stop Wasting Time on Manual Charts: Create Excel Line Graphs Instantly with AI
Tired of endlessly clicking through Excel menus to create a simple line graph? Discover how to visualize trends instantly. This guide contrasts the slow, manual method with a new AI-powered approach using Excelmatic, turning your raw data into insightful charts with just a few words.
Ruby • Data Visualization
Track Your Average Order Value with Excel AI Line Charts
Wondering if customers are spending more per order? Use Excel AI to track average order value (AOV) with clean, automated line charts that reveal the story behind your revenue.
Sally • Data Visualization
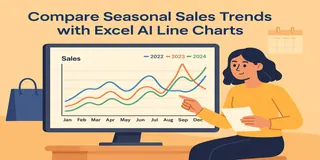
Compare Seasonal Sales Trends with Multi-Line Excel AI Charts
Track sales across multiple years and reveal your seasonality trends with just one Excel AI prompt. Excelmatic makes comparing monthly sales easy and accurate.
Sally • Data Visualization
Compare New vs Old Product Sales with Dual-Line Excel AI Charts
Want to know if your new product is helping or hurting your old one? Use Excel AI dual-line charts to reveal growth, cannibalization, and revenue shifts with crystal clarity.
Sally • Data Visualization
Compare Brand Sales Trends with Multi-Line Charts in Excel AI
Want to track your brand against competitors over time? Multi-line charts in Excel AI let you compare monthly sales trends instantly—no formulas, no formatting headaches.
Sally • Data Visualization
How to Create a Line Chart Instantly Using Excel AI Tools
Forget manual formatting—learn how Excel AI can create clear, clean line charts in one simple step.
Sally •
