In today's world, we are surrounded by data. From sales figures and market trends to website traffic and customer feedback, numbers hold the secrets to smarter decisions and groundbreaking insights. But raw data, in its native form of endless rows and columns in a spreadsheet, can be overwhelming and difficult to interpret. This is where data visualization comes in, acting as the universal language that translates complex data into clear, compelling, and actionable stories.

What is Data Visualization and Why Does It Matter?
At its core, data visualization is the practice of converting numerical data into a visual context, such as a map or a graph. The primary goal is to make the information easier for the human brain to understand and process. Instead of poring over spreadsheets, you can see trends, identify patterns, and spot outliers at a single glance. A well-crafted chart can reveal the narrative hidden within your numbers far more effectively than a table ever could.
The importance of this practice cannot be overstated. Effective visualization helps you grasp difficult concepts and identify new patterns, which is crucial for strategic business planning. When you can "see" your data, you can make faster, more informed decisions. Furthermore, it's a powerful tool for communication, enabling you to share your findings with colleagues, stakeholders, and clients in a way that is both engaging and easy to digest.
The Challenges of Traditional Visualization
For years, creating charts and graphs has been a staple of spreadsheet software. However, the traditional process is often cumbersome and unintuitive, presenting several significant hurdles. Users typically face a steep learning curve, needing to master complex menus and formatting options. The process is manual and time-consuming: you must meticulously select the correct data ranges, guess which chart type best represents your data, and then spend considerable time adjusting colors, labels, and titles to make the output presentable. This friction discourages exploration and can feel more like a technical chore than a creative process of discovery. For many, the effort required to create even a simple chart can be a barrier to unlocking the insights held within their data.
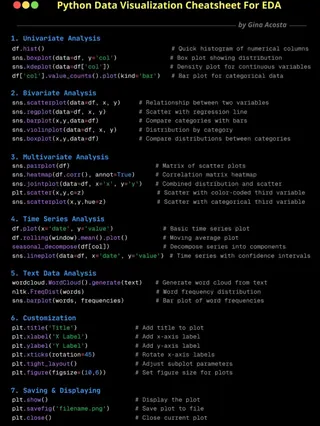
And if you want to create more complex visualizations, such as flowcharts or network diagrams, the process becomes even more daunting. You often need specialized software or advanced skills to draw shapes, connect lines, and format everything correctly. This complexity can lead to frustration and a reluctance to engage with data visualization at all.
Sometimes, you might write some python code to create the custom visualizations you need, but this requires programming knowledge and can be time-consuming.
The Excelmatic AI Way: Visualization Through Conversation
This is where Excelmatic revolutionizes the entire experience. We believe that creating a chart should be as easy as asking a question. By integrating a powerful AI engine, Excelmatic transforms data visualization from a manual task into an intelligent conversation. Instead of clicking through menus, you simply tell the AI what you want to see using natural language. The AI not only understands your request but also analyzes the underlying data to suggest the most effective chart type, automating the entire creation and formatting process. This shift empowers you to focus on what truly matters: understanding the story your data is telling.
Creating Any Chart Instantly with Excelmatic
Getting started with AI-powered visualization in Excelmatic is remarkably simple and intuitive. There's no need to select data ranges or browse chart menus. You just need to express your goal.
Let's walk through how you can create some of the most common and useful chart types with a simple command.
Crafting a Pie Chart for Proportions
Imagine you have a dataset containing sales figures broken down by different regions: North, South, East, and West. You want to quickly see which region contributes the most to your total sales. With traditional tools, you would need to select the region and sales columns, find the pie chart option, and then format the chart. With Excelmatic, you simply type a prompt like:
Show me the distribution of sales by region as a pie chart.
Instantly, the AI will analyze your data, identify the relevant columns, calculate the proportions, and generate a perfectly labeled and visually appealing pie chart. It understands context, so it knows "distribution" implies a part-to-whole relationship, for which a pie chart is ideal.
The following blogs will help you understand how to create pie charts and other data visualizations using Excelmatic:
 Data Visualization
Create Stunning Pie Charts in Excel: The Manual vs. AI Method
Tired of clicking through endless Excel menus to create a simple pie chart? This guide shows you the traditional method step-by-step and introduces a revolutionary AI-powered way to generate and customize charts instantly with a single command. See which method is right for you.
 Data Visualization
How to Create Stunning Excel Charts with AI
are you still troubled by the analysis of massive data through charts? still spending a lot of time converting tables into pictures? let ai help you! just upload the file and have a chat, accurate and professional charts will be generated..
 Data Visualization
Which Device Loses the Most Carts? Let a Pie Chart Show You Instantly
Mobile users abandoning more carts? Desktop converting better? Find out which screen hurts your revenue most with a simple AI chart.
 Data Visualization
What’s Your Best-Selling Product? Find Out Instantly with This AI Chart Maker
Tired of guessing which product is driving most of your sales? Let an AI chart maker generate a pie chart or bar graph that shows your top-selling items—instantly and clearly.
 Data Visualization
Visualize Regional Sales with Pie Chart Using Excel AI
Want to know which region brings in the most revenue? Use Excel AI to generate Pie Chart that make your sales distribution crystal clear—no pivots, no pain.
 Data Visualization
Visualize Your E-commerce Category Sales with a Pie Chart
Stop wasting time building charts manually. Discover how Excel AI can generate clean, insightful pie charts from your data with just one simple prompt.
 Data Visualization
How to Instantly Create Pie Charts in Excel with AI Tools
Make stunning pie charts in Excel without touching a pivot table. Learn how Excel AI makes data slices easy to understand and beautiful to present.
 Data Visualization
No Hand-Drawing Needed! Master Flowcharts with This One Trick!
Each time a flowchart is created, two software programs need to be switched, and the nodes and arrows have to be repeatedly adjusted. This not only wastes time but also makes the process prone to errors. With AI, data can be automatically retrieved and the flowchart can be drawn in just a few seconds. You can also become an expert in creating flowcharts.
 Data Visualization
Workplace Lesson One: No Tools for Data Visualization Flowcharts = Wasted Effort!
Are you still envious of your colleagues' data visualization charts? Are you still trying to stay up late and practice making charts? If you are still racking your brains thinking about which chart to use and spending a lot of time pondering, then you will fall behind others. Putting in all your effort is not as good as using the right method. With the right AI tools, you can also become a chart expert.
 Data Visualization
How to Instantly Spot Repeat Buyers vs Newbies Using AI Charts
Brand stickiness or one-time hype? A simple pie chart tells you whether customers are coming back—or walking away.
 Data Visualization
From a Massive Spreadsheet to a Perfect Pie Chart—In One Sentence
Need to show a breakdown of your sales data but dread the multi-step Excel process? This guide shows you how to use a simple AI command to instantly filter massive datasets and generate a clear, accurate pie chart, freeing you up to focus on insights, not clicks.
 Data Visualization
Tired of Confusing Spreadsheets? 5 Free AI Pie Chart Makers for Clear Sales Reports
Want to turn your numbers into clear, percentage-based pie charts in seconds? 📊 This guide reviews 5 free pie chart makers — including Excelmatic, Graphy, LiveChatAI, NoteGPT, and Edraw.AI — so you can choose the best tool to transform raw data into visuals that tell a story.
 Data Visualization
Solving Flowchart Creation Challenges with One Secret Weapon: AI Tools
Instead of putting in ten times the useless effort, choose a good tool. Just upload your requirements and let AI read the file, and it will automatically generate the chart you want. Creating flowcharts isn't as difficult as you think.
 Data Visualization
Need a Pie Chart? Stop Manually Filtering and Summing Data.
Making a pie chart in Excel often means tedious filtering and pivot tables. This guide shows how Excelmatic’s AI pie graph maker simplifies this. Turn complex requests into a single sentence and get instant, presentation-ready visuals.
Plotting a Trend with a Line Chart
Now, let's say your spreadsheet contains monthly revenue data for the past two years. You want to visualize the performance trend over this period to identify seasonal patterns or growth trajectories. Instead of the tedious process of selecting the time and revenue columns and configuring a line graph, you just tell Excelmatic:
Create a line chart for the monthly revenue trend over the last 24 months.
The Excelmatic AI will recognize the time-series nature of your data, automatically place the months on the X-axis in chronological order, and plot the corresponding revenue on the Y-axis, presenting you with a clean, insightful line chart.
The following blogs will help you understand how to create line charts and other data visualizations using Excelmatic:
 Data Visualization
Stop Wasting Time on Manual Charts: Create Excel Line Graphs Instantly with AI
Tired of endlessly clicking through Excel menus to create a simple line graph? Discover how to visualize trends instantly. This guide contrasts the slow, manual method with a new AI-powered approach using Excelmatic, turning your raw data into insightful charts with just a few words.
 Data Visualization
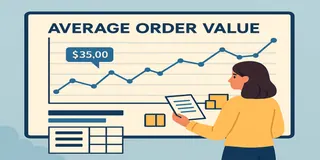
Track Your Average Order Value with Excel AI Line Charts
Wondering if customers are spending more per order? Use Excel AI to track average order value (AOV) with clean, automated line charts that reveal the story behind your revenue.
 Data Visualization
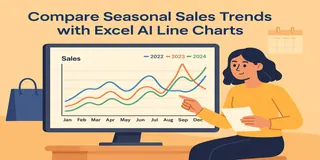
Compare Seasonal Sales Trends with Multi-Line Excel AI Charts
Track sales across multiple years and reveal your seasonality trends with just one Excel AI prompt. Excelmatic makes comparing monthly sales easy and accurate.
 Data Visualization
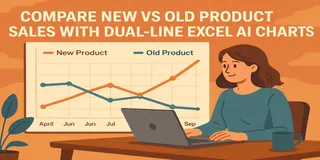
Compare New vs Old Product Sales with Dual-Line Excel AI Charts
Want to know if your new product is helping or hurting your old one? Use Excel AI dual-line charts to reveal growth, cannibalization, and revenue shifts with crystal clarity.
 Data Visualization
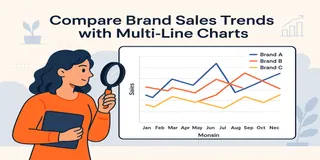
Compare Brand Sales Trends with Multi-Line Charts in Excel AI
Want to track your brand against competitors over time? Multi-line charts in Excel AI let you compare monthly sales trends instantly—no formulas, no formatting headaches.
 Data Visualization
How to Create a Line Chart Instantly Using Excel AI Tools
Forget manual formatting—learn how Excel AI can create clear, clean line charts in one simple step.
 Data Visualization
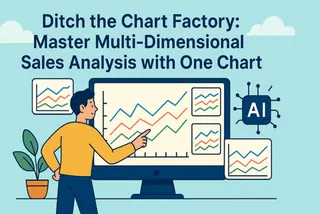
Ditch the Chart Factory: Master Multi-Dimensional Sales Analysis with One Chart
Tired of making endless charts in Excel to compare sales performance? This guide shows how to use a single AI command to generate one multi-line graph that reveals the complete picture. Turn complex data into clear, strategic insight.
 Data Visualization
From Gut-Feel to Data-Driven: Master Your Sales Forecast in 5 Minutes
Stop relying on gut-feel for your sales targets. This guide shows you how to escape the slow, manual process of Excel forecasting and use AI to turn raw data into a dynamic forecast line graph with just a few simple commands.
 Data Visualization
Still Guessing Your Best Time to Post? Let AI Find Your Account's Unique "Golden Hour"
The "best posting time" suggested by other bloggers' operation experiences may not work for your account. This article teaches you a scientific method: using AI chart tools like Kuangyou Excel to transform your messy backend data Excel sheet into a clear "fan activity heat map" with just one click. You will visually see the traffic peaks of your account throughout the 7 days of the week and 24 hours of a day, and bid farewell to the mystery of posting.
 Data Visualization
Running Out of Content Ideas? How AI Can Help You Find the Secret to Your Next Viral Post
Every content creator knows the feeling: you're out of ideas. Instead of endlessly scrolling for inspiration, what if you could let your own data guide you? This guide explores how AI tools like Excelmatic can transform your exported data from platforms like Instagram and TikTok into powerful dashboards. Discover how to find popular topics and formats to scientifically engineer your next viral post.
 Data Visualization
Track Monthly Sales Trends in Seconds with Excel AI Line Charts
Ditch manual work and discover how Excel AI tools like Excelmatic can create dynamic, trend-focused line charts from your raw data. Analyze monthly changes with zero stress.
Comparing Categories with a Bar Chart
Bar Charts are perfect for comparing distinct items or categories. Suppose you have data on the number of units sold for several different products. To see which product is the top performer, you can issue a simple command:
Generate a Bar Chart comparing the units sold for each product.
The AI will produce a horizontal Bar Chart that clearly ranks your products from highest to lowest sales, making direct comparison effortless.
The following blogs will help you understand how to create Bar Charts and other data visualizations using Excelmatic:
 Data Visualization
Stop Clicking: Create Perfect Bar Graphs in Excel with One Simple Prompt
Tired of endlessly clicking through Excel menus to create a simple bar graph? This guide shows you the old, slow way and a new, faster method using Excel AI. See how Excelmatic can turn your sales data into a perfect bar chart in seconds, just by asking.
 Data Visualization
Beyond Manual Charts: How AI Charts Transform Gantt Chart Creation
Explore how AI Charts are transforming Gantt diagram creation. This guide shows how AI instantly generates dynamic project timelines through simple commands, replacing complex manual processes with intelligent automation.
 Calculation
How to Create a "Top 10 Bestsellers" Chart in Excel in 5 Seconds
Don't get bogged down in PivotTables. Learn the AI-powered method to instantly find and visualize your top 10 bestselling products from thousands of order lines. A 5-minute analysis, now done in seconds.
 Data Visualization
How to Create a Sales Performance Bar Chart from Excel Data in Seconds
See how an AI-powered tool replaces the tedious, multi-step process of creating bar charts in Excel. Learn to generate a sorted sales performance leaderboard from raw data using just one natural language command.
 Data Visualization
How To Make Bar Chart Using AI (Step By Step)
Stop struggling to add labels to bar charts! Learn how to use AI to transform Excel data into charts in just a few seconds. This article will introduce two methods for drawing charts - traditional and AI - allowing you to gain a deeper understanding of AI tools.
 Data Visualization
Solving Flowchart Creation Challenges with One Secret Weapon: AI Tools
Instead of putting in ten times the useless effort, choose a good tool. Just upload your requirements and let AI read the file, and it will automatically generate the chart you want. Creating flowcharts isn't as difficult as you think.
 Data Visualization
How to Create Stunning Excel Charts with AI
are you still troubled by the analysis of massive data through charts? still spending a lot of time converting tables into pictures? let ai help you! just upload the file and have a chat, accurate and professional charts will be generated..
 Data Visualization
Which Products Are Quietly Failing? Let a Bar Chart Maker Show You the Ratings
Think your ratings are solid? Use this AI chart maker to break down star reviews and uncover the products that customers actually hate.
 Data Visualization
Which Ad Channel Gets the Most Refunds? Find Out in Seconds with This AI Chart
Your top-performing ad channel might be your top refund generator. Find out which platform really brings quality traffic using this AI refund chart maker.
 Data Visualization
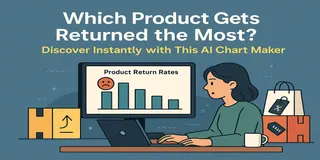
Which Product Gets Returned the Most? Discover Instantly with This AI Chart Maker
Don’t ignore your refund rates. This AI-powered Bar Chart maker shows you which products get returned the most—and helps you take action before it hurts your bottom line.
 Data Visualization
What’s Your Best-Selling Product? Find Out Instantly with This AI Chart Maker
Tired of guessing which product is driving most of your sales? Let an AI chart maker generate a pie chart or bar graph that shows your top-selling items—instantly and clearly.
 Data Visualization
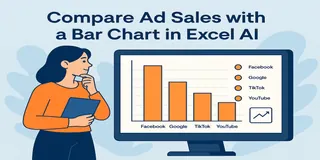
Compare Ad Channel Sales with a Bar Chart in Excel AI
Tired of guessing which ad channel works best? Let Excel AI generate Bar Charts comparing Facebook, Google, TikTok, and more—instantly and insightfully.
 Data Visualization
How to Instantly Create Bar Charts with Excel AI (No Manual Work Needed)
Stop wasting time building charts manually. Discover how Excel AI can generate clean, insightful Bar Charts from your data with just one simple prompt.
 Data Visualization
Create Bar Graphs in Excel The Classic Method vs. The Instant AI Approach
Tired of clicking through endless menus to create a simple bar graph in Excel? This guide shows you the traditional method and introduces a revolutionary AI-powered way to generate charts instantly with just a plain English command. Compare both and speed up your reporting.
 Data Visualization
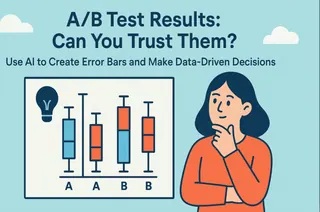
A/B Test Results: Can You Trust Them? Use AI to Create Error Bars and Make Data-Driven Decisions
Don't bet your budget on a slim margin in an A/B test. Discover how AI can create an error bar chart for you with a single sentence, turning statistical anxiety into clear, confident insights.
 Data Visualization
Stop Clicking Around: Add Error Bars to Excel Charts Instantly with AI
Tired of navigating endless menus just to add error bars to your Excel charts? See how Excelmatic, an Excel AI agent, lets you create charts with custom error bars using simple text commands, turning a tedious task into a quick conversation.
 Data Visualization
Ditch the Spreadsheet: 5 Free AI Bar Chart Makers That Create Visuals in Seconds
Looking for a free bar graph maker? 🚀 In this guide, we review 5 powerful AI tools—Excelmatic, Edraw.AI, LiveChatAI, Canva, and iWeaver—that let you instantly create bar charts online. Save time, visualize data beautifully, and pick the right tool for your workflow.
Showing Discrete Changes with a Column Chart
While similar to Bar Charts, column charts are often used to show changes in data over a discrete period. If you want to compare quarterly sales figures for the last fiscal year, a column chart is an excellent choice. You can ask:
Make a column chart of our quarterly sales for last year.
Excelmatic will create a vertical column chart, with each column representing a quarter, providing a clear view of performance fluctuations throughout the year.
The following blogs will help you understand how to create column charts and other data visualizations using Excelmatic:
Visualizing a Workflow with a Flowchart
Excelmatic's AI goes beyond numerical data. You can also create diagrams to visualize processes and workflows. This is incredibly useful for project planning, training materials, or process documentation. To map out a simple business process, you could instruct the AI as follows:
Build a flowchart for our customer support process, starting with 'Customer Submits Ticket', leading to 'Assign to Agent', then 'Investigate Issue', and ending with 'Provide Solution & Close Ticket'.
The AI will interpret this sequence and generate a clean, logical flowchart, saving you the manual effort of drawing and connecting shapes.
The following blogs will help you understand how to create flowcharts and other data visualizations using Excelmatic:
 Data Visualization
12 Best Types of Data Visualizations Every Professional Should Know
Explore 12 essential data visualization types and see how Excelmatic makes creating charts and dashboards fast and effortless.
 AI Dashboard
How to Create AI Dashboards Quickly and Easily: Step-by-Step Guide
Learn how AI automates data analysis and dashboard creation. Step-by-step guide to transform raw data into actionable insights.
 AI Dashboard
What is a Tactical Dashboard? (Example & How to Build with Excelmatic)
A tactical dashboard supports daily execution through short-term, actionable metrics, built faster with Excelmatic AI.
 AI Dashboard
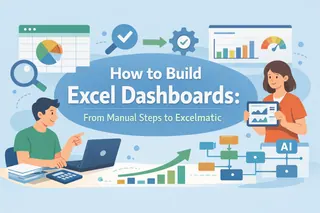
How to Build Excel Dashboards: From Manual Steps to Excelmatic
Master Excel dashboards from manual setup to automated insights with Excelmatic. Save time and visualize your data clearly.
 AI Dashboard
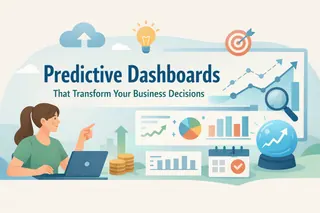
Predictive Dashboards That Transform Your Business Decisions
Predictive dashboards in Excelmatic help teams forecast trends, anticipate outcomes, and turn data into actionable business insights quickly and easily.
 AI Dashboard
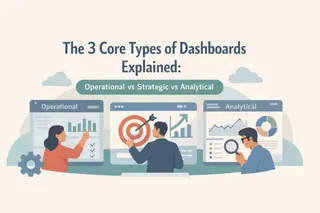
The 3 Core Types of Dashboards Explained: Operational vs Strategic vs Analytical
This guide explains the three core dashboard types and how AI tools help teams choose — and build — the right one faster.
 AI Dashboard
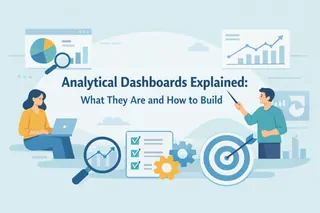
Analytical Dashboards Explained: What They Are and How to Build
Discover how to create analytical dashboards with Excelmatic, turning spreadsheets into AI-powered insights in minutes.
 AI Dashboard
No-Code Dashboard Tools in 2026: How Teams Turn Data into Decisions Faster
A practical guide to no-code dashboard tools and how teams use AI to turn everyday data into faster decisions.
 AI Dashboard
How to Build a Project Tracking Dashboard with Excelmatic AI
Build a real-time AI-powered Excelmatic dashboard to track projects, visualize KPIs, and make informed management decisions.
 AI Dashboard
Customer Retention Dashboard Example for SaaS Teams (Metrics & Structure)
Use a Customer Retention Dashboard to track SaaS users, reduce churn, and grow revenue.
 AI Dashboard
Business Forecast Dashboard: 5 Examples for SMBs
Explore business forecast dashboard examples that help SMBs gain clarity, improve budgeting, and plan with confidence.
 AI Dashboard
AI Marketing Attribution Dashboards: How to Stop Guessing Which Ads Actually Convert
How AI marketing attribution dashboards help Shopify brands identify which ads actually convert and where ad spend is wasted.
 AI Dashboard
5 Analytical Dashboard Types Operations Teams Rely On
The analytical dashboard types operations teams use most, and how Excelmatic fits into real Excel-based decision workflows.
 AI Dashboard
Operations Dashboard Examples for Businesses That Need Faster Decisions
A practical guide to operations dashboard examples for businesses, covering use cases, best practices, and execution-focused design.
 AI Dashboard
Strategic Dashboard: A Practical Guide with 5 Real-World Examples
This guide explains strategic dashboards, core layers, real use cases, and how leaders turn data into strategy.
 AI Dashboard
The 5 Pillars of a Strategic Dashboard for Better Decisions
This article explains the five pillars that turn dashboards into decision systems.
 AI Dashboard
Excel to Dashboard: How AI Visualizes Data Without Pivot Tables
Learn how AI transforms Excel files into dashboards without formulas, pivots, or manual formatting.
 AI Dashboard
Performance Dashboard: What It Is, Types, and Best Practices
A performance dashboard connects fragmented business metrics into a clear view that supports faster, better decision-making.
 AI Dashboard
5 Retail Dashboard Examples Every Team Should Use (How They Are Built)
Five practical retail dashboard examples that help teams connect performance data with better decisions.
 AI Dashboard
What Is a Logistics Dashboard? Types, Metrics, and AI Insights
An expert overview of logistics dashboards, their types, key metrics, and the role of AI in logistics decisions.
 AI Dashboard
What Is a Supply Chain Dashboard? Types, Metrics, and AI-Driven Insights
An expert overview of supply chain dashboards, their types, key metrics, and how AI supports better decisions.
 AI Dashboard
Market Analysis AI Dashboard for Marketing Teams: Features, Benefits, and Use Cases
Learn how a market analysis AI dashboard transforms marketing data into actionable insights and how Excelmatic brings AI-powered analysis to Excel users.
 AI Dashboard
What Is an Inventory Dashboard? Types, Metrics, and Examples
A practical guide to inventory dashboards, covering types, metrics, and how AI turns stock data into action.
 AI Dashboard
How to Build an E-commerce Financial Dashboard with AI
Learn how AI dashboards help e-commerce teams gain financial clarity beyond spreadsheets.
 AI Dashboard
What Is a Cash Flow Dashboard? Definition, Examples, and Benefits
This article explains what a cash flow dashboard is, the different types businesses use, and how dashboards improve cash visibility and financial decisions.
 AI Dashboard
How to Create a Sales Dashboard with AI for Revenue Tracking
This guide explains how to create a sales dashboard with AI for revenue tracking, using real-world workflows that help teams move from static reports to confident sales decisions.
 AI Dashboard
Project Dashboards: A Complete Guide to Types, Metrics, and Design
This guide explains what project dashboards are, the main types, key metrics, and how to design dashboards that support real project decisions.
 AI Dashboard
AI Dashboard Design Guide: Principles and Practical Workflow
This article explains key principles and a practical workflow for designing effective AI dashboards.
 AI Dashboard
7 Common Reporting Mistakes and How AI Dashboards Fix Them
This article breaks down 7 common reporting pitfalls and explains how AI dashboards help fix them with automation, accuracy, and clearer insights.
 AI Dashboard
Who Should Use an AI Dashboard Generator and Why It Matters
This article explains which teams benefit most and how Excel data turns into actionable insights.
 AI Dashboard
AI Dashboard Generator vs Excel: When It’s Time to Switch
Learn the signs your workflow no longer scales and how AI Dashboard Generators help teams move faster with less manual work.
 Data Visualization
Stop Wasting Time on Excel Charts: Create Them Instantly with AI
Tired of the endless clicking and formatting required to create the perfect Excel chart? Discover how to move from the tedious manual process to a simple, conversational approach with Excel AI, generating stunning data visualizations instantly.
 AI Dashboard
How to Craft Perfect Prompts for AI Dashboard Generators: Unlock Data Insights Fast
Master the art of prompt crafting to make AI dashboard generators work for you. This guide shows how clear, specific prompts unlock actionable insights and improve data-driven decision-making.
 AI Dashboard
How to Choose the Best AI Dashboard Generator for Your Team
From data quality to AI capabilities, our checklist will guide you to the best AI Dashboard Generator. Discover the key questions to ask before you choose.
 AI Dashboard
AI Dashboard Generators Functions: A Guide to the 3 Foundational Capabilities
AI Dashboard Generators: 3 core functions explained. Learn how predictive analytics, prescriptive insights & natural language interaction turn data into action.
 AI Dashboard
How to Use AI for Data Visualization and Dashboards — A Practical 5‑Step Workflow
A guide to using AI in data visualization. Learn a 5-step workflow that turns AI into an assistant, insight engine, and conversational partner to build dashboards and drive decisions.
 AI Dashboard
10 Top AI Dashboard Generators: The Ultimate 2025 Review (Free & Paid)
Our 2025 review compares 10 leading AI dashboard generators, from free starters to enterprise solutions. Get key features, pricing, and a clear guide to choose the right tool for your needs.
 AI Dashboard
How to Use an AI Dashboard Generator: 3 Steps to Your First Professional Dashboard
This guide shows how to use an AI dashboard generator in 3 steps — upload, ask, customizeto automate professional reports for marketing, sales, and product teams.
 AI Dashboard
AI Dashboard Generator: Ask a Question, Get a Dashboard
Learn how an AI Dashboard Generator uses your words to create dashboards. This post covers its definition, how it works, key benefits, real business applications, and tools like Excelmatic to try.
 AI Dashboard
What Is a Management Dashboard? A 3-Tier Guide with Examples
Learn the three-tier Management Dashboard framework: operational, strategic, and KPI dashboards. Transform Excel data into visual tools for clear, aligned decision-making.
 Data Analysis
5-Step AI Workflow for a Dynamic Annual Finance Report
A practical guide showing how a 5-step AI workflow transforms the annual financial report process from a static chore into a strategic, interactive analysis.
 AI Dashboard
How to Build a Personal Report Dashboard for Your Annual Report
Learn to build a Personal Report Dashboard for your annual review. This guide covers key metrics for health, wealth, growth, and shows how to visualize your data into actionable insights.
 AI Dashboard
KPI Dashboard Examples: Build a Live Strategic View in 4 Steps (Free AI Experience)
Explore KPI dashboard examples and a 5-step build guide. Learn to select metrics, design visuals, and use AI to create dashboards that drive strategic decisions.
 AI Dashboard
Executive Dashboard Examples & Templates (Updated for AI)
Executive Dashboard Examples & Templates for CEOs, CFOs, COOs, CMOs & CTOs. Learn what metrics matter, how to build dashboards, and how AI accelerates insight delivery.
 AI Dashboard
HR Dashboard Guide: 4 Live Boards That Prevent Costly Talent Mistakes
A guide to building four key HR dashboards: Recruitment, Resignation Risk, Performance Fairness, and Training ROI. Learn what metrics matter and how to move from data to action.
 AI Dashboard
How to Create a Sales Dashboard in Minutes: A Non-Technical Guide for Busy Teams
A practical guide to Sales Dashboards: understand key metrics, see common types, and learn the simple steps to create your own with modern tools. Start making data-driven decisions faster.
 AI Dashboard
How to Build Financial Dashboards with AI — Templates & Step-by-Step Guide
This guide explains how to build AI-powered financial dashboards for real-time insights. Covers dashboard types, key metrics, a 5-step framework, and tools like Excelmatic to transform financial management.
 AI Dashboard
Marketing Dashboard Templates: Create Actionable Dashboards in 4 Steps
A practical guide to building marketing dashboards for executives, managers, and analysts. Covers 3 dashboard types, core metrics, and a 4-step process using tools like Excelmatic for data-driven growth.
 AI Dashboard
7 Dashboard Design Best Practices: How to Build Clear, Actionable Dashboards
Overview of 7 dashboard design best practices: user-first design, right dashboard types, focused KPIs, clear visuals, layout rules and continuous optimization.
 Data Visualization
Stop Manually Updating Excel Charts: Auto-Show The Last 3 Months of Data
Tired of manually updating your Excel charts every month? This guide shows you the old, formula-heavy way and a new, faster method using Excel AI. See how Excelmatic can automate your dynamic charts with simple language commands.
 Data Visualization
Tired of Excel's Pie Chart Wizard? Create Perfect Charts in Seconds with AI
Stop wasting time navigating Excel's clunky chart menus. This guide reveals a faster way. See how an Excel AI agent like Excelmatic transforms your data into a perfect pie chart with just one sentence, saving you time and effort.
 Data Visualization
Stop Wasting Time on Manual Charts: How to Create Graphs in Excel with AI
Tired of the endless clicking to create the perfect Excel chart? From selecting data to formatting axes, the manual process is slow and frustrating. Discover how an Excel AI agent like Excelmatic can generate insightful charts from a simple text command, turning hours of work into minutes.
 Data Visualization
Tired of Manual Charting? Create Stunning Excel Column Charts in Seconds with AI
Tired of the endless clicking to create and format column charts in Excel? What if you could just ask for the chart you need? Discover how Excelmatic, an Excel AI Agent, transforms your raw data into stunning, presentation-ready column charts in seconds.
 Data Visualization
Stop Clicking Around: How to Create Stunning Excel Charts Instantly with AI
Tired of spending hours clicking through menus to create a simple Excel chart? This guide shows you how to ditch the manual process and use an Excel AI tool like Excelmatic to create stunning, presentation-ready charts just by describing what you want.
 Data Visualization
Stop Manually Highlighting Cells: How to Use AI for Conditional Formatting in Excel
Stop wasting time clicking through endless menus to apply conditional formatting in Excel. This guide shows you how to replace tedious manual steps with a powerful Excel AI, letting you visualize data and uncover insights in seconds.
 Data Visualization
Stop Fighting with Excel: Create Advanced Combination Charts in Seconds with AI
Tired of wrestling with Excel's frustrating chart options? Creating a combination chart to compare subscribers and open rates is a classic headache. Discover how Excel AI tools like Excelmatic let you build these advanced charts with a single sentence, saving you time and effort.
 Excel Automation
Excel Is More Than Spreadsheets: How AI Can Build Your Custom Tools for You
Tired of manually building complex calendars, inventory trackers, or project plans in Excel? This guide shows you the limitations of traditional templates and formulas and introduces a new way: using an Excel AI to generate these tools automatically with simple language prompts.
 Excel Automation
Tired of Manual Formatting? Style Your Excel Reports Instantly with AI
Tired of manually formatting every Excel report? Applying cell styles and conditional formatting rules is tedious and inconsistent. Discover how an Excel AI like Excelmatic can instantly create professional, data-driven formatting from a simple text command.
 Data Visualization
Stop Clicking Around: Add Error Bars to Excel Charts Instantly with AI
Tired of navigating endless menus just to add error bars to your Excel charts? See how Excelmatic, an Excel AI agent, lets you create charts with custom error bars using simple text commands, turning a tedious task into a quick conversation.
 Excel Charts & Visualization
Stop Clicking: Create Excel Scatter Plots Instantly with AI
Tired of clicking through menus to create a scatter plot in Excel, especially with multiple data series? This guide shows you a much faster way. Learn how to use Excel AI to generate complex correlation charts instantly, just by asking a question.
 Excel Automation
Stop Wasting Hours on Excel Formatting: Create Presentation-Ready Reports with AI
Tired of spending hours manually formatting Excel reports to make them look professional? You're not alone. Discover how an Excel AI agent like Excelmatic can instantly transform your raw data into polished, presentation-ready charts and tables, saving you time and eliminating tedious work.
 Data Visualization
Forget Manual Bins: Create Instant Histograms in Excel with AI
Tired of wrestling with the Data Analysis ToolPak or the FREQUENCY function just to visualize data distribution? Discover a smarter way. This guide shows you how an Excel AI can create perfect histograms instantly, saving you time and eliminating manual setup.
 Data Visualization
Stop Wasting Time on Manual Charts: Create Excel Line Graphs Instantly with AI
Tired of endlessly clicking through Excel menus to create a simple line graph? Discover how to visualize trends instantly. This guide contrasts the slow, manual method with a new AI-powered approach using Excelmatic, turning your raw data into insightful charts with just a few words.
 AI Dashboard
Stop Building Excel Dashboards Manually: Let AI Do It For You
Tired of spending hours wrestling with pivot tables, slicers, and chart formatting to build a sales dashboard? Discover a new way. This guide shows you how to ditch the manual grind and use Excel AI to create dynamic, interactive dashboards with simple text prompts.
 Data Visualization
Stop Building Excel Charts Manually: Let AI Do It for You
Tired of fiddling with Excel's chart wizard or hunting for the perfect template? Discover a new way to visualize your business data. This guide shows you how to ditch manual charting and use Excel AI to generate any chart you need, just by asking.
 Data Visualization
Stop Clicking: Create Perfect Bar Graphs in Excel with One Simple Prompt
Tired of endlessly clicking through Excel menus to create a simple bar graph? This guide shows you the old, slow way and a new, faster method using Excel AI. See how Excelmatic can turn your sales data into a perfect bar chart in seconds, just by asking.
 Excel Automation
Stop Wasting Hours on Sales Reports: How to Automate Excel Analysis with AI
Tired of spending hours cleaning raw sales data and wrestling with MID, SUMIFS, and COUNTIFS formulas? Discover how an Excel AI agent like Excelmatic can automate the entire process, from data extraction to creating summary charts, just by using plain English commands.
 AI Dashboard
The Ultimate Guide to Excel Dashboard Tools: Find Your Perfect Fit
This article explains the 8 core dashboard types used in modern business, who they are for, and their key KPIs. Learn the simple method to choose the right one, ensuring your data tells a clear and actionable story.
 AI Dashboard
Excelmatic Tutorial: From Excel to Dashboard with AI (The Complete Guide)
This comprehensive Excelmatic tutorial guides you from uploading your Excel file to sharing a finished AI-powered dashboard. Learn the 6-step process, key features, and how to edit every element. Master data visualization with no technical skills required.
 AI Dashboard
8 Types of Dashboards: How to Choose the Right One for Your Business
This article explains the 8 core dashboard types used in modern business, who they are for, and their key KPIs. Learn the simple method to choose the right one, ensuring your data tells a clear and actionable story.
 AI Dashboard
Why Your Next Dashboard Should Be AI-Powered: From Days to 10 Seconds
Why switch to AI dashboards? This post compares the old, slow process with the new AI-powered way that turns Excel into insights in seconds, detailing key advantages and a simple workflow.
 Data Visualization
Create Stunning Sankey Diagrams: A Guide for Excel, Python, and R
Sankey diagrams are powerful for visualizing flows, but creating them can be complex. This guide walks you through the process in Python and R, and compares the traditional add-in method in Excel with a new, AI-powered approach that simplifies everything.
 AI Dashboard
The Ultimate Guide to the Top 10 Dashboard Tools of 2025
This guide reviews 10 leading dashboard tools for 2025, including Excelmatic, Power BI, and Tableau. It provides clear pros, cons, and ideal use cases for each, helping you move beyond feature lists to find the tool that best matches your team's specific data goals and skills.
 AI Dashboard
What Is a Dashboard? Definition, Uses & Step-by-Step Guide
This guide covers the definition of a dashboard, its key uses in business, and why it's critical for real-time decisions. It also provides a step-by-step tutorial on how to build a professional dashboard quickly using Excelmatic.
 Excel Tips
Effortless PivotTable Conditional Formatting: A Modern Guide
Elevate your PivotTable reports. This guide compares two manual methods for applying conditional formatting in Excel with a new, AI-driven solution that lets you get instant visual insights using simple English commands. Spend less time clicking and more time analyzing.
 Data Visualization
Create Stunning Pie Charts in Excel: The Manual vs. AI Method
Tired of clicking through endless Excel menus to create a simple pie chart? This guide shows you the traditional method step-by-step and introduces a revolutionary AI-powered way to generate and customize charts instantly with a single command. See which method is right for you.
 Data Visualization
Creating Insightful Combo Charts in Excel The Classic vs. AI Approach
Unlock the power of combo charts to visualize diverse datasets in a single, insightful graphic. This guide walks you through creating them, comparing the classic manual process with a revolutionary AI-powered method that generates perfect charts from a simple command.
 Data Visualization
2 Fast Ways to Make a Gantt Chart in Excel (Including an AI Method)
Struggling with complex project timelines? This guide walks you through creating a Gantt chart in Excel. Discover the traditional step-by-step method and see how an AI assistant can build a professional chart for you in seconds, saving you time and effort.
 Data Visualization
Create Bar Graphs in Excel The Classic Method vs. The Instant AI Approach
Tired of clicking through endless menus to create a simple bar graph in Excel? This guide shows you the traditional method and introduces a revolutionary AI-powered way to generate charts instantly with just a plain English command. Compare both and speed up your reporting.
 Data Visualization
Create Stunning Line Graphs in Excel: The Classic vs. The AI-Powered Way
Tired of clicking through endless menus to create a simple line graph in Excel? This guide shows you the traditional way and introduces a revolutionary AI method. Just ask, and your chart is ready. Discover how to turn your data into compelling visual stories in seconds, not minutes.
 Excel Tips
4 Effortless Ways to Create a Histogram in Excel (2025 Guide)
Struggling to visualize data distribution? This guide breaks down four powerful methods for creating histograms in Excel. We cover everything from the simple built-in chart to advanced formulas, and even introduce an AI-powered approach for instant results. Master histograms today!
 Data Visualization
Excel Sparklines: The Ultimate Guide to Mini Data Visualizations
Master Excel Sparklines to create compact, in-cell data visualizations. This guide covers everything from basic creation to advanced customization and compares the classic manual approach with the speed and simplicity of using an AI-powered assistant for instant trend analysis.
 Data Visualization
Beyond Manual Charts: How AI Charts Transform Gantt Chart Creation
Explore how AI Charts are transforming Gantt diagram creation. This guide shows how AI instantly generates dynamic project timelines through simple commands, replacing complex manual processes with intelligent automation.
 Data Visualization
The Future is Visual: Exploring the Top 8 AI Tools for Data Visualization
We review the Top 8 AI Tools for Data Visualization, including Tableau, Power BI & ThoughtSpot. Learn how AI automates charts and insights. Excelmatic emerges as the top choice for its seamless, intuitive interface that simplifies data storytelling.
 Data Visualization
Top 6 AI Chart Tools in 2025: That Turn Complex Data into Insights Instantly
This comprehensive guide reviews the six best AI chart tools of 2025 - Excelmatic, Julius AI, Microsoft Power BI, ChartAI, GraphMaker, and Alteryx - comparing their unique features and ideal application scenarios for different business needs.
 Data Visualization
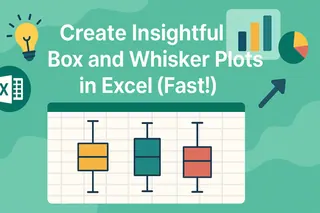
Create Insightful Box and Whisker Plots in Excel (Fast!)
Tired of complex steps to create a box and whisker plot in Excel? This guide shows you three methods, including the traditional approach and a revolutionary AI-powered solution that generates perfect charts from a simple sentence. Unlock deeper data insights faster.
 Data Visualization
Stop Staring at Spreadsheets: How AI Data Visualization Turns Your Data into Instant Insights
This guide breaks down how AI data visualization transforms raw numbers into actionable insights. Explore tools like Excelmatic that analyze data through natural language, compare traditional and AI methods, and learn to create effective visualizations without technical expertise.
 Data Visualization
Research Paper Due? Create Publication-Ready Charts in 2 Minutes
The tedious process of manually formatting research charts in Excel is over. This guide reveals a simple AI method that turns experimental data into journal-ready visualizations with proper error bars and statistical markers using a single command.
 Calculation
How to Create a "Top 10 Bestsellers" Chart in Excel in 5 Seconds
Don't get bogged down in PivotTables. Learn the AI-powered method to instantly find and visualize your top 10 bestselling products from thousands of order lines. A 5-minute analysis, now done in seconds.
 Data Visualization
The 6 Best AI Chart Generators: An In-depth Review for 2025
Manual chart creation is a major efficiency bottleneck. AI chart generators offer a powerful solution, creating stunning visualizations from simple text commands. This guide reviews the 6 best tools on the market, including Excelmatic and Copilot, to help you choose the perfect one and transform your workflow.
 Data Visualization
Is Your Marketing Spend Working? Find Clarity in 5 Minutes with One Scatter Plot
Don't just guess if your marketing spend is driving sales. This guide shows how to move beyond confusing Excel charts and use AI to create a scatter plot that gives you a clear, data-backed answer—including a simple explanation of what the numbers actually mean.
 Graph Maker
Still Manually Building Charts Before a Meeting? Visualize Your Data with a Single Sentence.
Stop wasting time on manual chart creation. This guide shows how Excelmatic, an AI graph maker, replaces complex Excel steps with one command. Instantly turn raw data into insightful charts and focus on the story behind your data.
 Data Visualization
Need a Pie Chart? Stop Manually Filtering and Summing Data.
Making a pie chart in Excel often means tedious filtering and pivot tables. This guide shows how Excelmatic’s AI pie graph maker simplifies this. Turn complex requests into a single sentence and get instant, presentation-ready visuals.
 Data Visualization
From a Massive Spreadsheet to a Perfect Pie Chart—In One Sentence
Need to show a breakdown of your sales data but dread the multi-step Excel process? This guide shows you how to use a simple AI command to instantly filter massive datasets and generate a clear, accurate pie chart, freeing you up to focus on insights, not clicks.
 Data Visualization
Stop Building Charts Manually: How Excelmatic Turns Spreadsheets into Interactive Visuals with a Single Sentence
What if you could turn a boring spreadsheet into a dynamic, interactive chart just by typing a single sentence? This post reveals how Excelmatic's conversational AI does exactly that. We'll show you real-world examples of how teams are saving hours of manual work and creating reports that actually impress. Get ready to stop clicking and start talking to your data.
 Data Visualization
Ditch the Chart Factory: Master Multi-Dimensional Sales Analysis with One Chart
Tired of making endless charts in Excel to compare sales performance? This guide shows how to use a single AI command to generate one multi-line graph that reveals the complete picture. Turn complex data into clear, strategic insight.
 Data Visualization
From Gut-Feel to Data-Driven: Master Your Sales Forecast in 5 Minutes
Stop relying on gut-feel for your sales targets. This guide shows you how to escape the slow, manual process of Excel forecasting and use AI to turn raw data into a dynamic forecast line graph with just a few simple commands.
 Data Visualization
Master Your Year-End Budget in 3 Simple Steps: Ditch the Excel Grunt Work
The annual budget review often means hours of manual Excel work, trapping managers in a cycle of data aggregation and complex formulas. This article breaks down the common pitfalls of traditional budgeting and introduces a new, AI-powered workflow. See how you can use simple conversational commands within Excel to transform raw expense data into a strategic budget plan, freeing you up to focus on decision-making.
 Data Visualization
From Paycheck to Paycheck to Pocketing a Profit: Master Your Budget in 3 Simple Steps
Payday feels great, but the end of the month often brings the same question: "Where did my money go?" This article tackles the frustration of traditional budgeting and introduces a new, AI-powered way to manage your finances. See how simple conversational commands can transform your chaotic bank statements into clear, actionable insights, helping you finally break the paycheck-to-paycheck cycle.
 Data Visualization
How to Create a Sales Performance Bar Chart from Excel Data in Seconds
See how an AI-powered tool replaces the tedious, multi-step process of creating bar charts in Excel. Learn to generate a sorted sales performance leaderboard from raw data using just one natural language command.
 Data Visualization
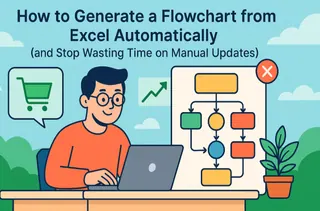
How to Generate a Flowchart from Excel Automatically (and Stop Wasting Time on Manual Updates)
Is your team still wasting hours manually redrawing process diagrams every time a rule changes? This step-by-step guide walks you through a smarter workflow. Learn how to use a simple Excel file as the single source of truth for your SOPs, and let an AI instantly translate it into a polished, up-to-date flowchart. Free up your team for more valuable work.
 Data Visualization
How to Make a Flowchart: Stop Drawing, Start Generating with AI
Tired of manual flowcharts in Visio? This guide shows how our AI maker turns Excel data into professional diagrams in seconds. Stop drawing, save hours & learn how!
 Data Visualization
Data Insight: Is Your 'Hustle Culture' Silently Killing Innovation?
As a leader, you see execution soaring while innovation stalls. The problem is disconnected data. Learn how Excelmatic merges HR and product metrics, turning your strategic intuition into powerful visual evidence and driving smarter, sustainable growth.
 Data Visualization
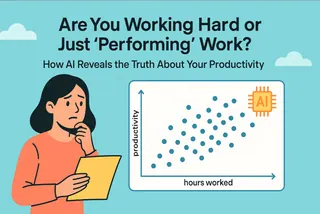
Are You Working Hard or Just 'Performing' Work? How AI Reveals the Truth About Your Productivity
Stop equating long hours with high value. This guide walks you through using an AI tool like Excelmatic to turn a simple work log into a powerful personal productivity report.
 Data Visualization
How To Create a Combo Chart with AI in Seconds, Not Hours in Excel
Tired of Excel's multi-step process for creating combo charts? This guide shows you how to use AI to generate a professional column and line chart with a single command. Turn your data into clear insights for your next business report.
 Top AI Tools
From Data to Wow in Minutes: 10 AI Chart Generators That Will Change How You Work
Manually creating charts in Excel is slow, tedious, and often frustrating. What if you could turn a messy spreadsheet into a presentation-ready report with a single prompt? We tested dozens of tools to find the 10 best AI chart generators, including our top pick, excelmatic. From instant dashboards to publication-quality visuals, this guide has the right tool to save you hours of work. See the full list inside.
 Data Visualization
From Gut Feeling to Data-Driven: AI-Powered Radar Charts for Smarter Performance Reviews
Subjective feedback can hurt team morale. While radar charts provide a clear, objective view of employee skills, creating them manually in Excel is a nightmare for most managers.Learn how to upload your team's ratings and generate a professional competency map with a single command, making your next performance review the most effective one yet.
 Data Visualization
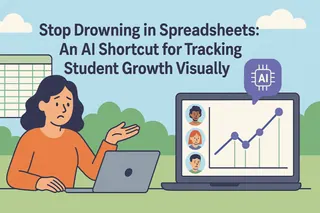
Stop Drowning in Spreadsheets: An AI Shortcut for Tracking Student Growth Visually
The days of manually filtering and charting student data for hours are over. This guide reveals a simple AI shortcut that transforms your master grade sheet into beautiful, individual progress curves with a single command. Free up your time and lead every parent-teacher conference with clear, visual evidence of student growth.
 Data Visualization
Does More Homework Time Equal Better Grades? Test Your Teaching Intuition with AI
As a teacher, you sense that more homework time doesn't always lead to better grades, but how do you prove it? This guide shows you how to use AI tools like Excelmatic to easily analyze the relationship between homework time and exam scores with a scatter plot. Turn your intuition into data-backed evidence without learning complex Excel functions.
 Data Visualization
Overwhelmed by Your Project Plan? Turn an Excel List into a Gantt Chart with AI
Stop treating your Gantt chart like a static picture. Discover how to turn a basic Excel task list into a live, dynamic project plan with AI. It's powerful project management, without the traditional headache.
 Data Visualization
Data Over 'Gut Feeling': Easily Prove Your Business Hunches with an AI Scatter Plot
Your gut feeling is a great start, but data makes it a fact. Learn how to skip the complicated steps in Excel and use AI to instantly create a scatter plot with a trendline. It's time to turn your data into a convincing story.
 Data Visualization
A/B Test Results: Can You Trust Them? Use AI to Create Error Bars and Make Data-Driven Decisions
Don't bet your budget on a slim margin in an A/B test. Discover how AI can create an error bar chart for you with a single sentence, turning statistical anxiety into clear, confident insights.
 Data Visualization
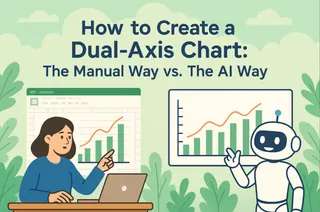
How to Create a Dual-Axis Chart: The Manual Way vs. The AI Way
A dual-axis chart is a powerful reporting tool, but creating one in Excel can be a multi-step process. This guide walks you through the traditional method and shows how you can use AI to generate the same professional chart with a single command.
 Top AI Tools
A Marketer's Guide: How to Turn Messy Ad Data into Insightful Charts, Hands-Free
Stop wasting hours on manual marketing reports. This guide shows you how modern AI tools can automatically merge files, calculate metrics, and generate presentation-ready charts from a few simple prompts, freeing you up to focus on strategy, not spreadsheets.
 Data Visualization
Still Guessing Your Best Time to Post? Let AI Find Your Account's Unique "Golden Hour"
The "best posting time" suggested by other bloggers' operation experiences may not work for your account. This article teaches you a scientific method: using AI chart tools like Kuangyou Excel to transform your messy backend data Excel sheet into a clear "fan activity heat map" with just one click. You will visually see the traffic peaks of your account throughout the 7 days of the week and 24 hours of a day, and bid farewell to the mystery of posting.
 Data Visualization
Still Manually Calculating ROI for Reports? The Best Marketers Are Already Using AI
After a campaign, the real bottleneck isn't the presentation—it's the tedious process of cleaning data, matching spend to conversions, and calculating ROI in Excel. This article walks through a real-world marketing report scenario to show how you can use Excelmatic to replace VLOOKUPs and complex formulas. See how three plain-English commands can get you from raw data to actionable insights in under 10 minutes.
 Data Analytics
How to Use AI to Calculate Channel ROI & Optimize Your Marketing Budget
In the budget meeting, Marketing and Sales present conflicting views on channel value, but the CFO only wants to see the numbers. This is a common corporate dilemma: marketing leads and sales conversions exist as separate data islands. This article demonstrates how to use an AI tool to build a "data bridge" replacing subjective arguments with objective ROI analysis to ensure every dollar is spent effectively.
 Data Visualization
Running Out of Content Ideas? How AI Can Help You Find the Secret to Your Next Viral Post
Every content creator knows the feeling: you're out of ideas. Instead of endlessly scrolling for inspiration, what if you could let your own data guide you? This guide explores how AI tools like Excelmatic can transform your exported data from platforms like Instagram and TikTok into powerful dashboards. Discover how to find popular topics and formats to scientifically engineer your next viral post.
 Data Analytics
Why 90% of Your Sales Pipeline is Noise (And How AI Finds the 10% That Matters)
Tired of the daily grind of chasing a long list of leads? The truth is, 80% of your results come from 20% of your deals, but finding that 20% feels impossible. This practical guide introduces AI as your "sales co-pilot," showing you exactly how to analyze your CRM export file to pinpoint your high-value, "must-win" deals. Stop the guesswork and start closing smarter.
 Data Visualization
Your Order Files Are Worth a Fortune: 3 AI Tools That Make Your Data Talk
Every order file you export is a data goldmine, but analyzing it manually in Excel feels like digging with a spoon. This guide reviews the 3 best AI data analysis tools that let you chat with your data and uncover game-changing insights from a simple CSV. Includes a clear guide to choosing the right one for your business.
 Data Visualization
New Hire Overwhelmed? Ditch the Thick Manuals and Create Visual Onboarding Flowcharts with AI
Hi, how does the expense reimbursement process work?"... These headache-inducing questions stem from one core problem: text-only policies are counter-intuitive. This article shows you how to use an AI tool like Excelmatic to instantly "translate" dry process descriptions into visual action guides that new hires understand in seconds. It's time to end inefficient communication and create the perfect first day.
 Data Visualization
Goodbye, Boring Reports: 5 AI Chart Generation Tools That Make Your Marketing Data Speak
Stop letting your valuable marketing data get lost in boring spreadsheets. This guide introduces 5 powerful AI chart generation tools that act as your 'data interpreter,' translating raw numbers from Excel & CSV files into compelling visual stories. Discover how to create stunning reports in minutes, not hours.
 Data Visualization
Ditch the Spreadsheet: 5 Free AI Bar Chart Makers That Create Visuals in Seconds
Looking for a free bar graph maker? 🚀 In this guide, we review 5 powerful AI tools—Excelmatic, Edraw.AI, LiveChatAI, Canva, and iWeaver—that let you instantly create bar charts online. Save time, visualize data beautifully, and pick the right tool for your workflow.
 Data Visualization
Tired of Confusing Spreadsheets? 5 Free AI Pie Chart Makers for Clear Sales Reports
Want to turn your numbers into clear, percentage-based pie charts in seconds? 📊 This guide reviews 5 free pie chart makers — including Excelmatic, Graphy, LiveChatAI, NoteGPT, and Edraw.AI — so you can choose the best tool to transform raw data into visuals that tell a story.
 Data Visualization
How to Create a Bar Chart in Excel: The Smart Way with AI (Bar Diagram Maker)
Manually creating Excel bar charts is tedious and error-prone: adding labels, adjusting formats, and updating data can easily lead to mistakes. This article introduces the AI tool Excelmatic, which simplifies the process—upload data, describe needs, and automatically generate professional charts with labels. AI automatically optimizes colors and formats, supports real-time data updates, saving 80% of chart creation time. Combined with techniques like manually adjusting label positions and customizing colors, easily create both professional and aesthetically pleasing visualization effects.
 Data Visualization
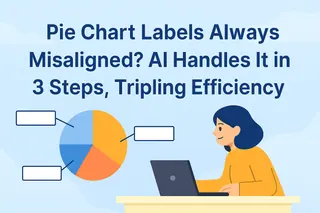
Pie Chart Labels Always Misaligned? Stop Wasting Effort—AI Fixes It in 3 Steps
This article addresses issues such as easy mislabeling of values and disordered labels in traditional pie chart creation, proposes thoughts on them, and introduces a new tool—AI—to help everyone create charts more efficiently and accurately, tripling your charting efficiency.
 Data Analytics
All-Nighters Are Over: Turns a Full Day of Reports Into 5 Minutes—Insights, Growth Plans, PRDs in One Click
This article focuses on hands-on experience with efficiency AI tools, highlighting the shortcomings of old data processing methods and the core capabilities of the new product Excelmatic – prompt-free generation of Instagram data charts + full reports in 5 seconds (based on Python to prevent data hallucinations), three actionable plans for 20% DAU growth in 2 weeks with a 100K budget, automatic PRD generation for the 'Love Letter Blind Box' mini-program (including market research), plus learning resources for AI applications in cross-border e-commerce (comparison table + summary + validation checklist).
 Data Visualization
How To Make Bar Chart Using AI (Step By Step)
Stop struggling to add labels to bar charts! Learn how to use AI to transform Excel data into charts in just a few seconds. This article will introduce two methods for drawing charts - traditional and AI - allowing you to gain a deeper understanding of AI tools.
 Data Visualization
Solving Flowchart Creation Challenges with One Secret Weapon: AI Tools
Instead of putting in ten times the useless effort, choose a good tool. Just upload your requirements and let AI read the file, and it will automatically generate the chart you want. Creating flowcharts isn't as difficult as you think.
 Data Visualization
No Hand-Drawing Needed! Master Flowcharts with This One Trick!
Each time a flowchart is created, two software programs need to be switched, and the nodes and arrows have to be repeatedly adjusted. This not only wastes time but also makes the process prone to errors. With AI, data can be automatically retrieved and the flowchart can be drawn in just a few seconds. You can also become an expert in creating flowcharts.
 Data Visualization
Workplace Lesson One: No Tools for Data Visualization Flowcharts = Wasted Effort!
Are you still envious of your colleagues' data visualization charts? Are you still trying to stay up late and practice making charts? If you are still racking your brains thinking about which chart to use and spending a lot of time pondering, then you will fall behind others. Putting in all your effort is not as good as using the right method. With the right AI tools, you can also become a chart expert.
 Data Visualization
No More Excuses for Low Efficiency—AI Turns Excel into Charts Effortlessly!
Data visualization helps you present your results more effectively in your reports. Manual drawing of charts from Excel is too cumbersome. Five practical tools can generate various types of chart analyses for you with just one click.
 Data Visualization
How to Create Stunning Excel Charts with AI
are you still troubled by the analysis of massive data through charts? still spending a lot of time converting tables into pictures? let ai help you! just upload the file and have a chat, accurate and professional charts will be generated..
 Data Visualization
Which Device Loses the Most Carts? Let a Pie Chart Show You Instantly
Mobile users abandoning more carts? Desktop converting better? Find out which screen hurts your revenue most with a simple AI chart.
 Data Visualization
When Do Customers Really Buy? Use AI to Uncover Time-of-Day Purchase Patterns
Are you marketing when your customers are actually shopping? Use AI-generated charts to analyze purchase timing trends and get your timing right.
 Data Visualization
Which Products Are Going Viral? Track Popularity Momentum with AI Charts
See which products are trending and which are losing steam. Track your product's popularity momentum in seconds with Excelmatic's AI-powered line charts.
 Data Visualization
What Are Your Users Really Doing? Let AI-Generated Charts Reveal the Truth
From product views to cart drops—AI-generated charts expose every behavioral twist and turn in your user data.
 Data Visualization
How to Instantly Spot Repeat Buyers vs Newbies Using AI Charts
Brand stickiness or one-time hype? A simple pie chart tells you whether customers are coming back—or walking away.
 Data Visualization
Do Low Ratings Really Mean Trouble? Use a Combo Chart to Reveal the Truth
Average reviews can be misleading. Combine ratings and return rate in one AI-powered chart to see which products are quietly failing your customers.
 Data Visualization
Which Products Are Quietly Failing? Let a Bar Chart Maker Show You the Ratings
Think your ratings are solid? Use this AI chart maker to break down star reviews and uncover the products that customers actually hate.
 Data Visualization
Which Ad Channel Gets the Most Refunds? Find Out in Seconds with This AI Chart
Your top-performing ad channel might be your top refund generator. Find out which platform really brings quality traffic using this AI refund chart maker.
 Data Visualization
Which Product Gets Returned the Most? Discover Instantly with This AI Chart Maker
Don’t ignore your refund rates. This AI-powered Bar Chart maker shows you which products get returned the most—and helps you take action before it hurts your bottom line.
 Data Visualization
What’s Your Best-Selling Product? Find Out Instantly with This AI Chart Maker
Tired of guessing which product is driving most of your sales? Let an AI chart maker generate a pie chart or bar graph that shows your top-selling items—instantly and clearly.
 Data Visualization
Track Your Average Order Value with Excel AI Line Charts
Wondering if customers are spending more per order? Use Excel AI to track average order value (AOV) with clean, automated line charts that reveal the story behind your revenue.
 Data Visualization
Compare Seasonal Sales Trends with Multi-Line Excel AI Charts
Track sales across multiple years and reveal your seasonality trends with just one Excel AI prompt. Excelmatic makes comparing monthly sales easy and accurate.
 Data Visualization
Visualize Category Sales by Region with Donut Charts in Excel AI
Want to show regional sales and category distribution in one chart? Excel AI donut charts let you visualize multiple layers of insight in a beautiful, interactive way.
 Data Visualization
Visualize Regional Sales with Pie Chart Using Excel AI
Want to know which region brings in the most revenue? Use Excel AI to generate Pie Chart that make your sales distribution crystal clear—no pivots, no pain.
 Excel Tips
Category Comparison Charts Made Simple: Excel AI Magic with Excelmatic
Turn spreadsheet categories into clear comparisons with Excelmatic and save hours of manual work.
 Data Visualization
Compare New vs Old Product Sales with Dual-Line Excel AI Charts
Want to know if your new product is helping or hurting your old one? Use Excel AI dual-line charts to reveal growth, cannibalization, and revenue shifts with crystal clarity.
 Data Visualization
Compare Brand Sales Trends with Multi-Line Charts in Excel AI
Want to track your brand against competitors over time? Multi-line charts in Excel AI let you compare monthly sales trends instantly—no formulas, no formatting headaches.
 Data Visualization
Compare Ad Channel Sales with a Bar Chart in Excel AI
Tired of guessing which ad channel works best? Let Excel AI generate Bar Charts comparing Facebook, Google, TikTok, and more—instantly and insightfully.
 Data Visualization
Track Monthly Sales Trends in Seconds with Excel AI Line Charts
Ditch manual work and discover how Excel AI tools like Excelmatic can create dynamic, trend-focused line charts from your raw data. Analyze monthly changes with zero stress.
 Data Visualization
Visualize Your E-commerce Category Sales with a Pie Chart
Stop wasting time building charts manually. Discover how Excel AI can generate clean, insightful pie charts from your data with just one simple prompt.
 Data Visualization
Create Combo Charts in Excel Instantly with AI: Sales + KPIs in One View
Combine sales and profit metrics in one clear Excel chart—Excel AI tools like Excelmatic make combo charts effortless and beautiful.
 Data Visualization
How to Instantly Create Pie Charts in Excel with AI Tools
Make stunning pie charts in Excel without touching a pivot table. Learn how Excel AI makes data slices easy to understand and beautiful to present.
 Data Visualization
How to Create a Line Chart Instantly Using Excel AI Tools
Forget manual formatting—learn how Excel AI can create clear, clean line charts in one simple step.
 Data Visualization
How to Instantly Create Bar Charts with Excel AI (No Manual Work Needed)
Stop wasting time building charts manually. Discover how Excel AI can generate clean, insightful Bar Charts from your data with just one simple prompt.
 Excel Tips
Excel Grade Analysis Made Simple: Visualize Student Performance with Excel AI
Excelmatic turns clunky grade spreadsheets into smart visual dashboards—no formulas, just plain English.
 Excel Tips
Master Cost Structure Analysis in Excel – No Formulas Needed
Still building pivots and charts to analyze your cost categories? Learn how Excelmatic uses AI to break down cost structures instantly and deliver insights you can act on.
 AI Tools by Industry
Top AI Tools for Data Analysts in 2025
Clean smarter, visualize faster, and work better. These are the top AI-powered tools every data analyst should know in 2025—from Excelmatic to Polymer.
 Excel Tips
How to Analyze User Purchase Paths Using Excel AI
Understand how users convert using Excel AI tools. Analyze session trends, traffic source performance, and user behavior without complex formulas.
 Excel Tips
How to Analyze Survey Data in Excel Without Writing a Single Formula
Turn raw survey feedback into visual dashboards and key insights without a single formula. Here's how to analyze survey results in Excel the smart way.
 Excel Tips
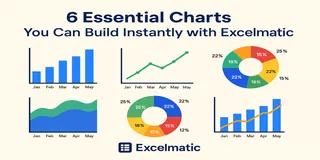
6 Essential Charts You Can Build Instantly with Excelmatic
Learn how I use Excelmatic to instantly create 6 powerful chart types from Excel tables — no formatting, no formulas, no stress.
 AI for Excel
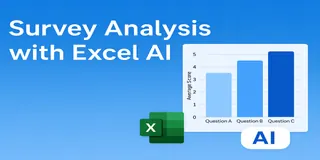
How I Analyze Survey Data Faster with Excel AI — No Formulas Needed
Stop wasting hours on survey analysis. See how Excelmatic helps you clean, calculate, and chart survey data instantly — with just one question.
 Excel Tips
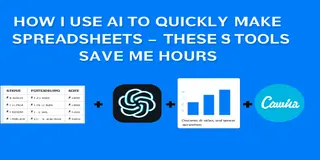
How I Use AI to Quickly Make Spreadsheets — These 3 Tools Save Me Hours
You don’t need formulas to make a report. Here’s how I use 3 AI tools to go from messy data to polished charts.
 Excel Tips
5 AI Tools That Actually Make Excel and Data Work Easier
Sick of writing formulas, formatting charts, or designing slides? These 5 AI tools will change how you work with Excel, data, and presentations.
 Excel Tips
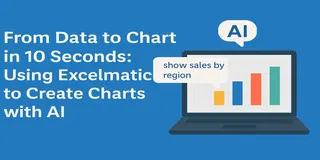
From Data to Chart in 10 Seconds: Using Excelmatic to Create Charts with AI
Manually creating charts in Excel is overrated. See how Excelmatic turns your spreadsheet into polished charts in just one prompt.
 Excel Tips
Let AI Handle Your Excel Charts: A Smarter Copilot Alternative?
Is Excelmatic the smarter Copilot alternative for Excel charts? Learn how this AI-powered chart editor saves you time and delivers better-looking visuals, faster.
 Excel Tips
ChatGPT + Excel AI = A Productivity Powerhouse? Here’s What You Need to Know
Structure data with ChatGPT, visualize it instantly with Excelmatic. This AI combo can seriously boost your Excel productivity.
 Excel Tips
Ditch Your Excel Templates: Automate Data Analysis with AI (ChatGPT + Excelmatic in Action)
Break free from Excel template limitations with ChatGPT and Excelmatic. Learn AI-powered data analysis workflow for dynamic business insights without complex formulas.
 Excel Tips
5 Excel Charts You Can Instantly Generate with AI Using Excelmatic
Learn how to turn your Excel data into charts in seconds using AI. This blog shows 5 real-life examples of pie, bar, and line charts built with Excelmatic — and the insights it can generate automatically.
 Excel Tips
Master Data Analysis with Excelmatic: No Formulas, No Coding, Just Actionable Insights
Transform your Excel spreadsheets into powerful insights with Excelmatic’s AI. No formulas, no coding—just natural language questions and instant results.
 Excel Tips
Excel AI Tool: data analysis in 1 second with natural language!
Excel AI tool: data analysis in 1 second with natural language!
 Excel Tips
How to Perform a Breakeven Analysis with Excel AI
Discover how AI is revolutionizing financial planning with Excelmatic. Learn to perform break-even analysis in Excel using traditional methods and Excelmatic's AI-powered tools. Simplify your financial planning with instant calculations and intuitive visualizations. Read more to see how Excelmatic can transform your business!
 Excel Tips
AI Chart Generator – Instantly Transform Your Data into Stunning Visualizations
Transform raw spreadsheet data into stunning visualizations instantly with Exelmatic AI. No design skills needed – just click and create professional charts effortlessly!
 Excel Tips
How to Create Stunning Excel Charts with Excel AI via Excelmatic
Today, let's explore how to use Excelmatic to quickly create high-quality charts in Excel.
 Excel Tips
Excelmatic: AI-Powered Excel Chart Editor That Brings Data to Life!
Excelmatic helps you gain insights quickly and presents them in the most intuitive way.
 Excel Tips
AI-Powered Excel Data Analysis: Unlock Insights with Excelmatic
Excelmatic leverages AI technology to make data analysis as easy as having a conversation!
 Excel Tips
AI and Excel: Revolutionizing Data Processing
Today, we explore the differences between AI and Excel in data handling, and the unique advantages AI brings.
 Excel Tips
AI Meets Excel: Excelmatic is Here for Smarter Data Handling
Now, Excelmatic, driven by AI, is here to make Excel data analysis simple and intelligent
 Excel Tips
How to delete duplicates in Excel
let me introduce you to a powerful and simple method -- the use of Excelmatic to remove duplicate content in Excel.
 Excel Tips
Excelmatic small classroom: those things that create stunning data visualizations
Today, I will share with you how to use Excelmatic to create a stunning data visualization.
 Excel Tips
E-commerce data analysis is too much of a headache, Excelmatic chart visualization to the rescue!
In the field of e-commerce, data is like a mine of treasures, but at the same time, it is also a big mountain of headaches.
 Excel Tips
Transform Your Excel Data into Stunning Visuals with Excelmatic
with Excelmatic, generating a variety of charts has become incredibly simple and efficient.
 Excel Tips
AI-Powered Excel: Efficiency Boosts So High, Your Boss Will Be Stunned!
with advancements in AI, a tool called Excelmatic has been developed. It brings AI into Excel, making data analysis much easier and more efficient.
With Excelmatic, data visualization is no longer a barrier but a gateway to discovery. By removing technical complexity, we empower every user to transform numbers into narratives and data into decisions, all with the simplicity of a conversation.
You can also check this Unlocking Data Insights with AI: A Beginner's Guide to Data Analytics to learn how AI tools like Excelmatic can help you analyze data and extract valuable insights.
