Excel AI for Sales Leaders
Smarter, Faster Revenue Insights
Turn messy Excel and CRM exports into clear insights, forecasts, and reports — without formulas, dashboards, or BI tools. Ask questions in plain English. Get charts, explanations, and executive-ready reports in minutes — not hours.
The Reality of Sales Reporting Today
Sales reporting should support decisions — not slow them down. But for most teams, it still feels harder than it should be.

Common Pain Points
If this sounds familiar, you're not alone — and this is exactly what Excelmatic fixes.

Weekly sales reporting eats hours
Manual exports, broken formulas, and last-minute fixes before forecast calls.

CRM data isn't analysis-ready
Exports need heavy cleanup before they're usable in Excel.

Pipeline and quota visibility is fragmented
Different reps, regions, and tools — no single source of truth.

Forecasting depends on gut feel
Too many manual scenarios. Not enough confidence in the numbers.
The AI Sales Analyst for You
Excelmatic AI is like having an AI sales analyst working on your uploaded spreadsheets.
It processes your Excel files or CRM exports after upload and automatically turns raw data into:
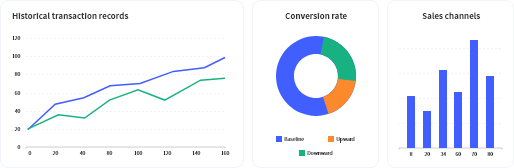
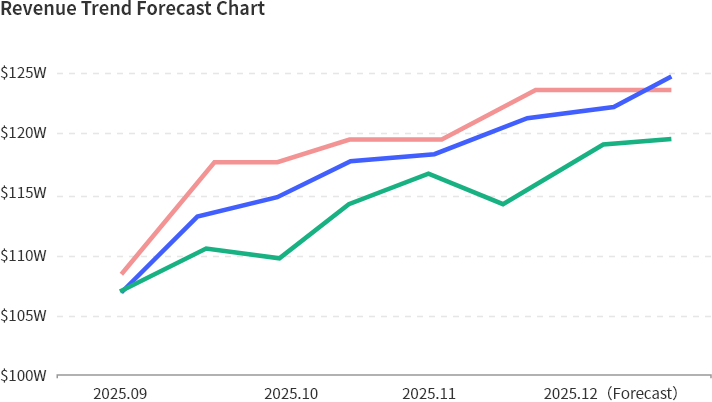
Smart Sales Forecasting
Forecast revenue using historical deals, win rates, and pipeline data — including simple base, upside, and downside scenarios. No manual models required.
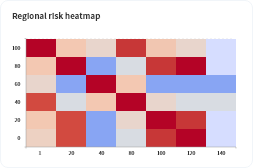
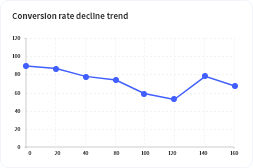
Pipeline & Deal Risk Detection
Automatically spot stalled deals, aging stages, conversion drops, and regional risks before they impact revenue.
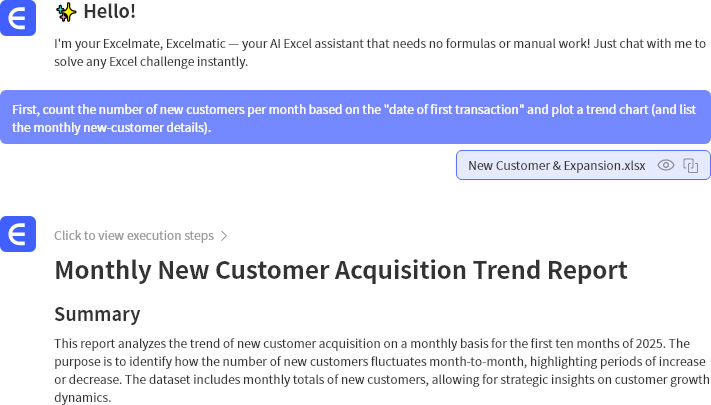
Natural Language Sales Analysis
Ask questions like "Why is EMEA behind quota?" Get instant charts and clear explanations based on your uploaded data in any language.

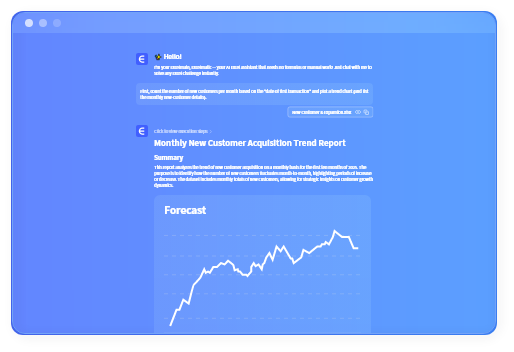
Automated Sales Reporting
Generate weekly or monthly sales summaries automatically. Export to Excel with one click.
No setup. No complex models. Just answers.
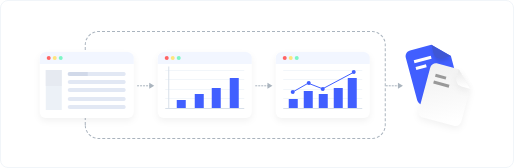
How Excelmatic works
Watch Excelmatic in Action
What You Can Do With Excelmatic AI
AI Sales Forecasting
Scenario forecasting and win-rate analysis
Forecast calls, board decks
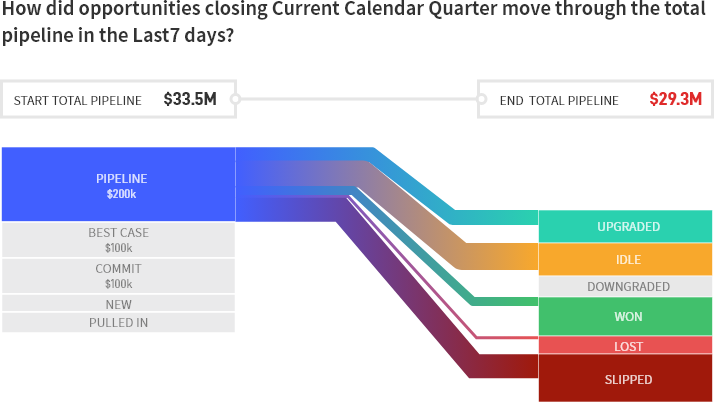
Pipeline Risk Detection
Identify stalled deals and aging stages
Weekly pipeline reviews
Natural Language Query
Ask questions in any language
Sales leaders, RevOps

Automated Reporting
Auto-refresh reports with Excel export
Weekly & monthly reporting
Core Features
Smart Sales Forecasting
Automatically generate accurate revenue predictions based on real pipeline dynamics and historical performance.

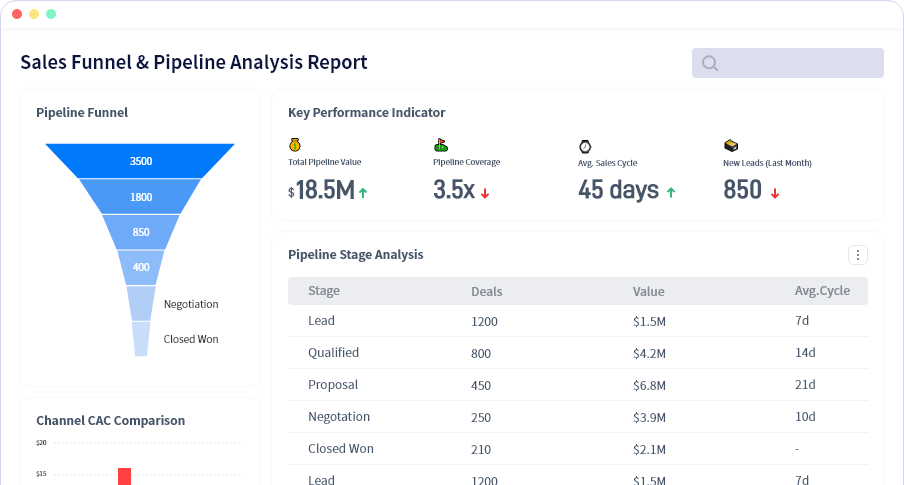
Pipeline Health & Deal Risk Detection
Identify high-risk deals and bottlenecks before they hurt your forecast.

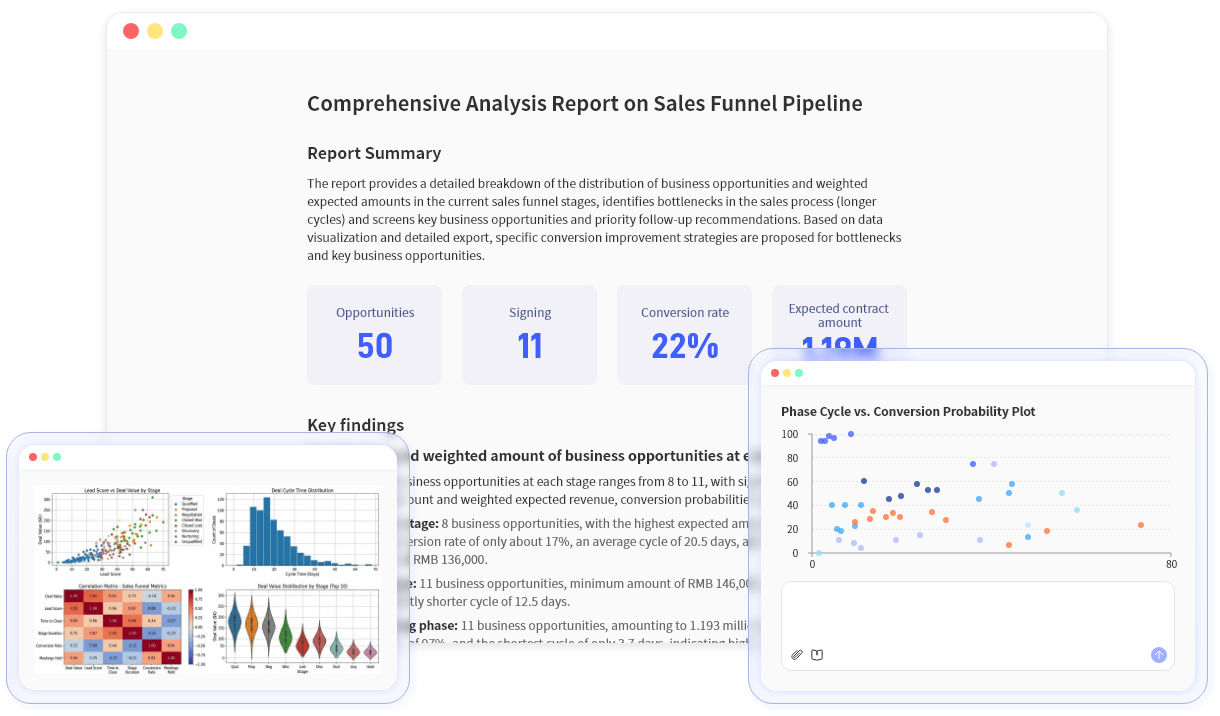
Natural Language Sales Analysis
Ask questions like "What's our win-rate trend by segment?" and get instant charts and summaries.

Automated Sales Reporting
Weekly and monthly sales reports generated automatically, ready to share.

Sales & E-commerce Use Cases
Excelmatic supports a wide range of sales and e-commerce analysis — without adding complexity.
Sales teams use it to:
AI Sales Performance Analysis
AI for Activity & Conversion Analysis
Predictive Sales Analytics & Scenario Modeling
Account & Territory Insights for Sales Leaders
Automated Sales Report Generation & Excel
Pipeline Risk & Deal Health Analysis
Smart Dashboards, Funnels & Visualizations
Sales Data Analysis with Excelmatic
E-commerce teams use it to:
E-commerce Sales & Revenue Analytics
Multi-Channel E-commerce Reporting
Marketplace Performance Dashboards (Amazon / Shopee / Lazada)
E-commerce Forecasting: Demand, Revenue & Inventory Alignment
What Sales Leaders Say
See how sales teams are transforming their workflow with Excelmatic AI
Elizabeth Thornton
VP of Sales
Our weekly sales review dropped from 3 hours to 10 minutes.
Victoria Pembroke
Head of RevOps
Forecast calls are now about decisions, not spreadsheets.
Charles Wentworth
Regional Director
We caught a 15% win-rate drop weeks earlier than before.
Excelmatic vs Traditional Sales Tools
Why teams switch from CRM dashboards, BI tools, and manual Excel models:
Pricing for Every Sales Team
Try Excelmatic free — no credit card required. See how much time you save on your very next weekly or monthly report.

Essential
Billed monthly.
- 150 chat messages / month
- 5 uploaded files / chat
- 50M file upload limit
- Chat history saved for 180 days
- 150 image to excel / month
- 10 excel to dashboard / month
- 20 editable blocks / dashboard
- Available dashboard themes: 4
- Basic analysis
- All Charts
- Template generation
- Storage Space: 500M
- Download excel
- Download charts
- Email support
Professional
Billed monthly.
- Everything in Essential, plus
- Unlimited chat messages
- 10 uploaded files / chat
- 100M file upload limit
- Chat history saved for 360 days
- Unlimited image to excel
- 30 excel to dashboard / month
- 30 editable blocks / dashboard
- Available dashboard themes: 6
- Model analysis & prediction
- All Charts + Custom theme
- Storage Space: 1GB
- Exclusive support

Premium
Billed monthly.
- Everything in Professional, plus
- 30 uploaded files / chat
- 300M file upload limit
- 100 excel to dashboard / month
- Unlimited editable blocks
- All dashboard themes available
- Storage Space: 10GB
FAQ
Common questions about Excelmatic for Sales.
Is my sales data secure?
Yes. Enterprise-grade encryption and SOC 2 Type II compliance. Your CRM exports and sales data are processed securely and never used to train our models.
Does it work with CRM exports?
Yes — Salesforce, HubSpot, Pipedrive, and most CRM export formats are supported. Upload your CSV/Excel files and start analyzing immediately.
What file types do you support?
.xlsx, .csv, .xls, .xlsm, .odb
Can it replace my Excel models?
Yes — by analyzing your uploaded files and generating results automatically. No more manual formulas or complex models.
How does forecasting work?
Our AI analyzes your historical deal data, win rates, and current pipeline to generate accurate forecasts. You can create multiple scenarios and adjust assumptions.
Does it support scenario forecasting?
Yes. Base, upside, and downside scenarios are included. You can adjust win rates, deal sizes, and other variables.
How accurate are the forecasts?
Our AI uses your historical data and current pipeline to generate forecasts. Accuracy depends on data quality, but most teams see 85-95% accuracy.
Do you export to PowerPoint (PPT)?
Not currently. You can share results via link and export images.
Accelerate Sales Reporting. Improve Forecast Accuracy. Lead With Confidence.
Upload a sales report, pipeline export, or CRM data and see shareable outputs in minutes.