Finance AI for Excel
Find and explain money variances in your spreadsheets—in minutes
The best AI workspace for finance teams. Upload your Excel files and generate variance analysis, forecasts, anomaly detection, charts, and shareable reports using natural language.

What you can improve
See measurable improvements in your finance workflows from day one.
Faster close review
Spend less time hunting and explaining variances

Higher confidence
Catch unusual movements early with anomaly detection

Faster planning
Run forecasts and scenarios without rebuilding views

Aligned stakeholders
Share one consistent, updated set of outputs

Copy/paste prompts (get value in minutes)
Use these prompts as-is, then adjust names to match your data.
Variance & narrative
Summarize this quarter's P&L and explain margin changes.
Explain operating expense variance month over month and highlight unusual items.
What drove the change in gross margin vs last quarter?
Budget vs Actual
Show top expense drivers vs budget by department.
List the largest unfavorable variances and explain likely drivers.
Anomaly detection
Detect anomalies in revenue and operating expenses by month.
Flag unusual movements by account and explain thresholds.
Show a heatmap of outliers across departments and periods.
Forecasting & scenarios
Forecast revenue for the next 6 months by region.
Create base/upside/downside scenarios for gross margin.
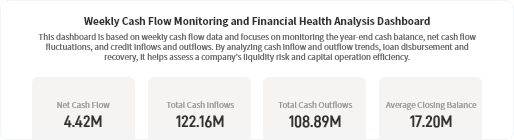
Forecast cashflow and summarize key drivers.
Core finance workflows
Everything you need for modern finance analysis and reporting.
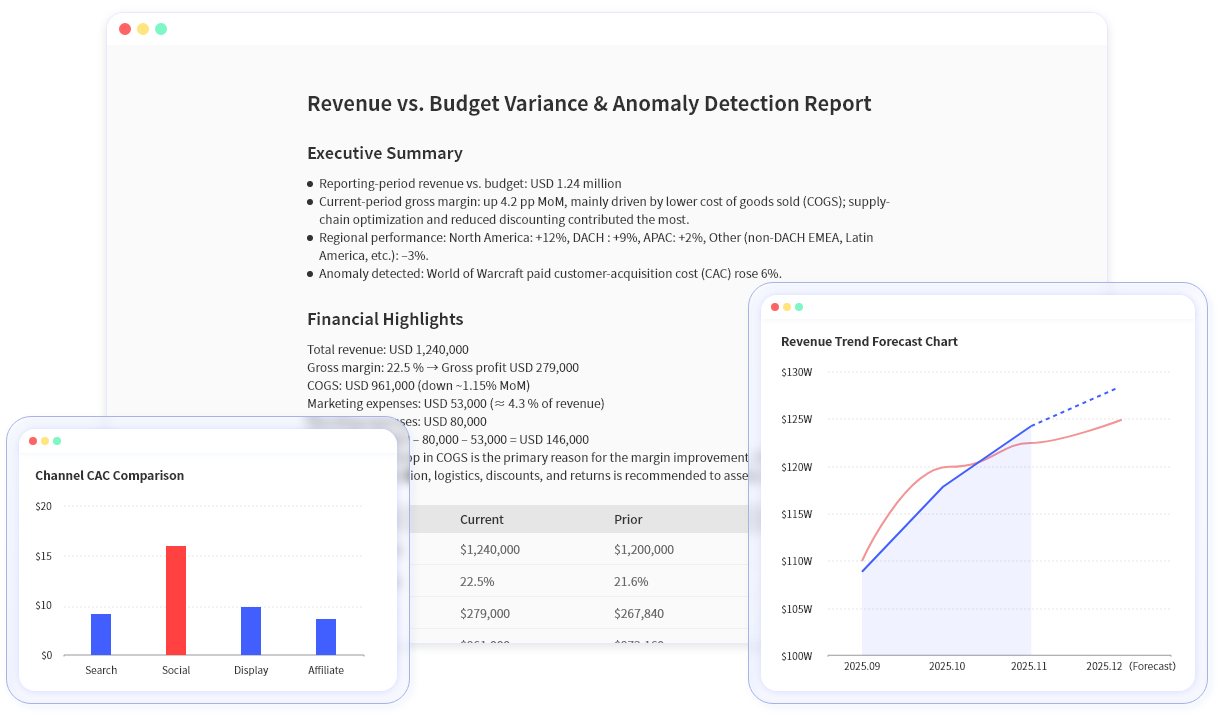
Natural-language financial analysis
Ask questions and get structured outputs—tables, charts, and narrative explanations.
Anomaly detection
Excelmatic can produce anomaly point lists, threshold explanations, and heatmaps to spot outliers quickly.

Forecasting & scenario modeling
Excelmatic uses Python-based analysis to run forecasting models. Forecast KPIs like revenue, costs, cashflow, compare scenarios, and slice forecasts by any dimension.
Shareable reporting outputs
Share results via link, export images for documents and updates, and keep stakeholders aligned on one version of the outputs.
Data handling & privacy
Your financial data is secure and private. Here's how we handle it.
Is my data used for training?
No. Your data is not used for training. We respect your privacy and keep your financial information completely separate from our AI training processes.
How long is my data stored?
Files are stored in your user space and retained until you delete them. You have full control over your data retention.
Can I delete my data?
Yes—you can delete files in your user space at any time. We make it easy to manage and remove your data whenever you need to.
How does sharing work?
Sharing is via a link. Currently, anyone with the link can access the shared content. You control what you share and when.
FAQ
Common questions about Excelmatic for Finance.
Is Excelmatic an Excel add-in?
Not yet. Excelmatic is a browser-based product today.
What file types do you support?
.xlsx, .csv, .xls, .xlsm, .odb
Do you export to PowerPoint (PPT)?
Not currently. You can share results via link and export images.
Do you support anomaly detection?
Yes—outputs can include anomaly lists, threshold explanations, and heatmaps.
Can I forecast by department/region/product?
Yes—if your dataset includes those fields, Excelmatic can forecast and analyze by dimension.
Do you offer SSO?
Not at this time.
Do you have integrations or an API?
Not currently.
Get started
Upload a P&L, Budget vs Actual, Cashflow, or a detailed ledger extract and see shareable outputs in minutes.
