
'%3e%3crect%20id='矩形_7888'%20data-name='矩形%207888'%20class='cls-1'%20width='20'%20height='20'%20rx='4'%20transform='translate(6260%20-4478)'/%3e%3cpath%20id='联合_155'%20data-name='联合%20155'%20class='cls-2'%20d='M6.074,12.147a6.207,6.207,0,0,1-.621-.031A6.087,6.087,0,0,1,.031,6.694a6.177,6.177,0,0,1,0-1.241A6.086,6.086,0,0,1,5.453.031,6.177,6.177,0,0,1,6.074,0H9.152V2.029H6.074a4.053,4.053,0,0,0-3.916,3.03H9.152V7.088H2.158a4.053,4.053,0,0,0,3.916,3.03H9.152v2.029Z'%20transform='translate(6264.693%20-4473.9)'/%3e%3c/g%3e%3c/svg%3e)
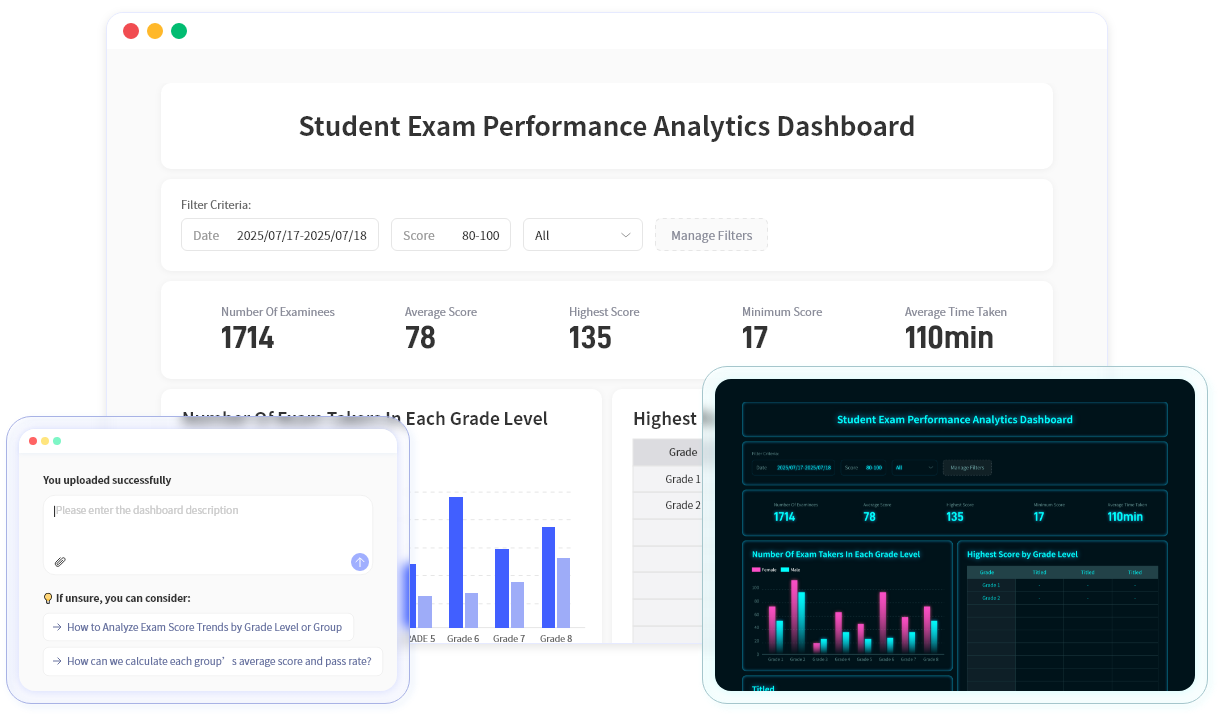
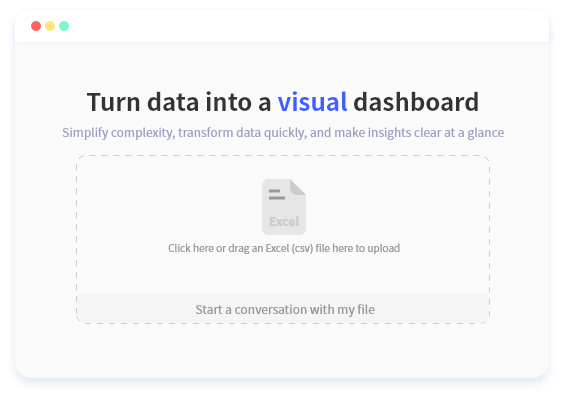
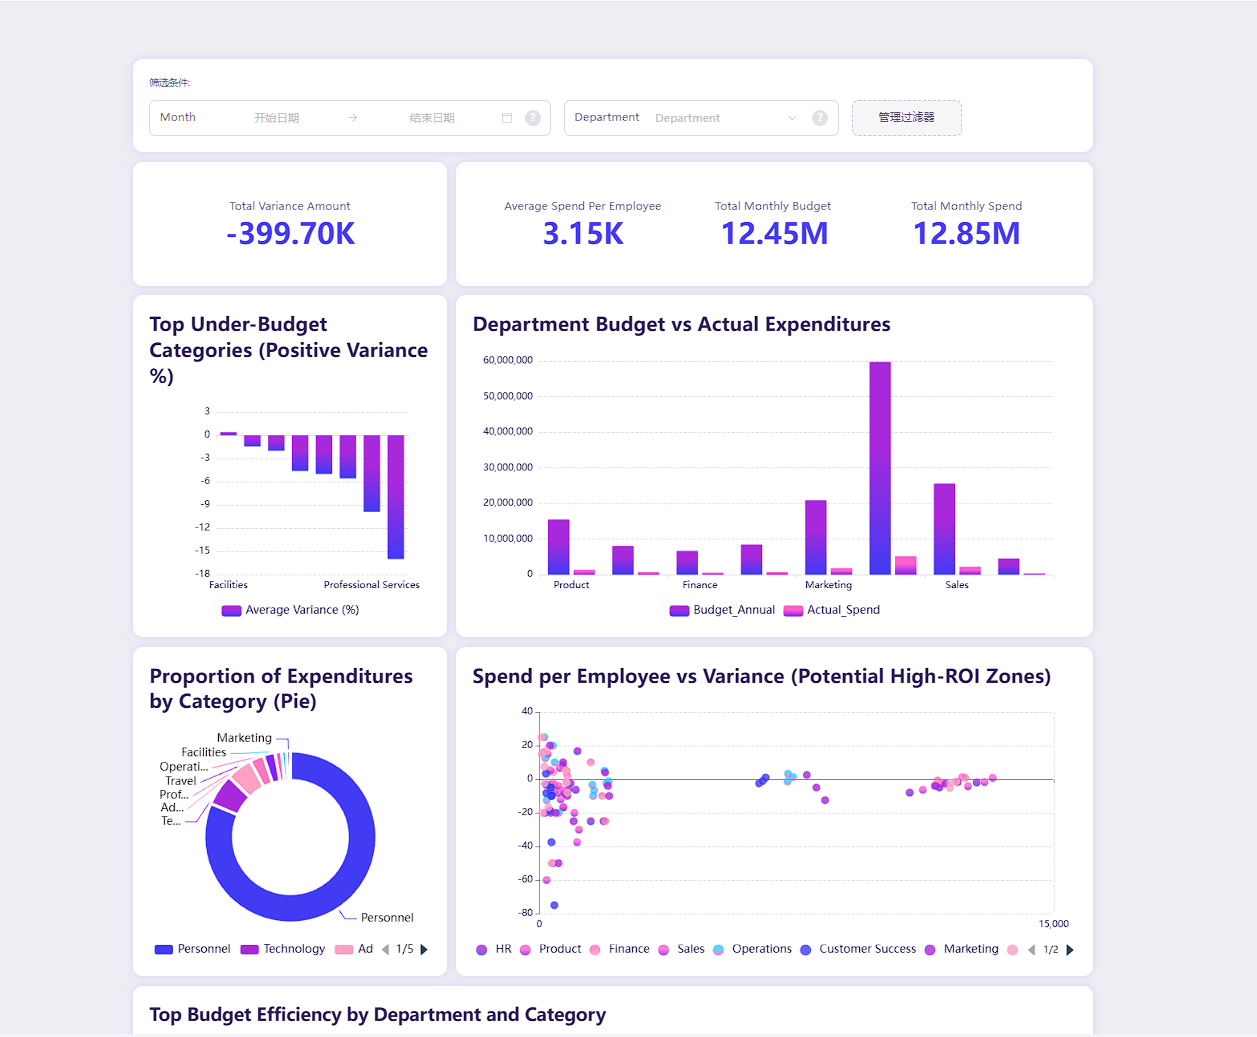
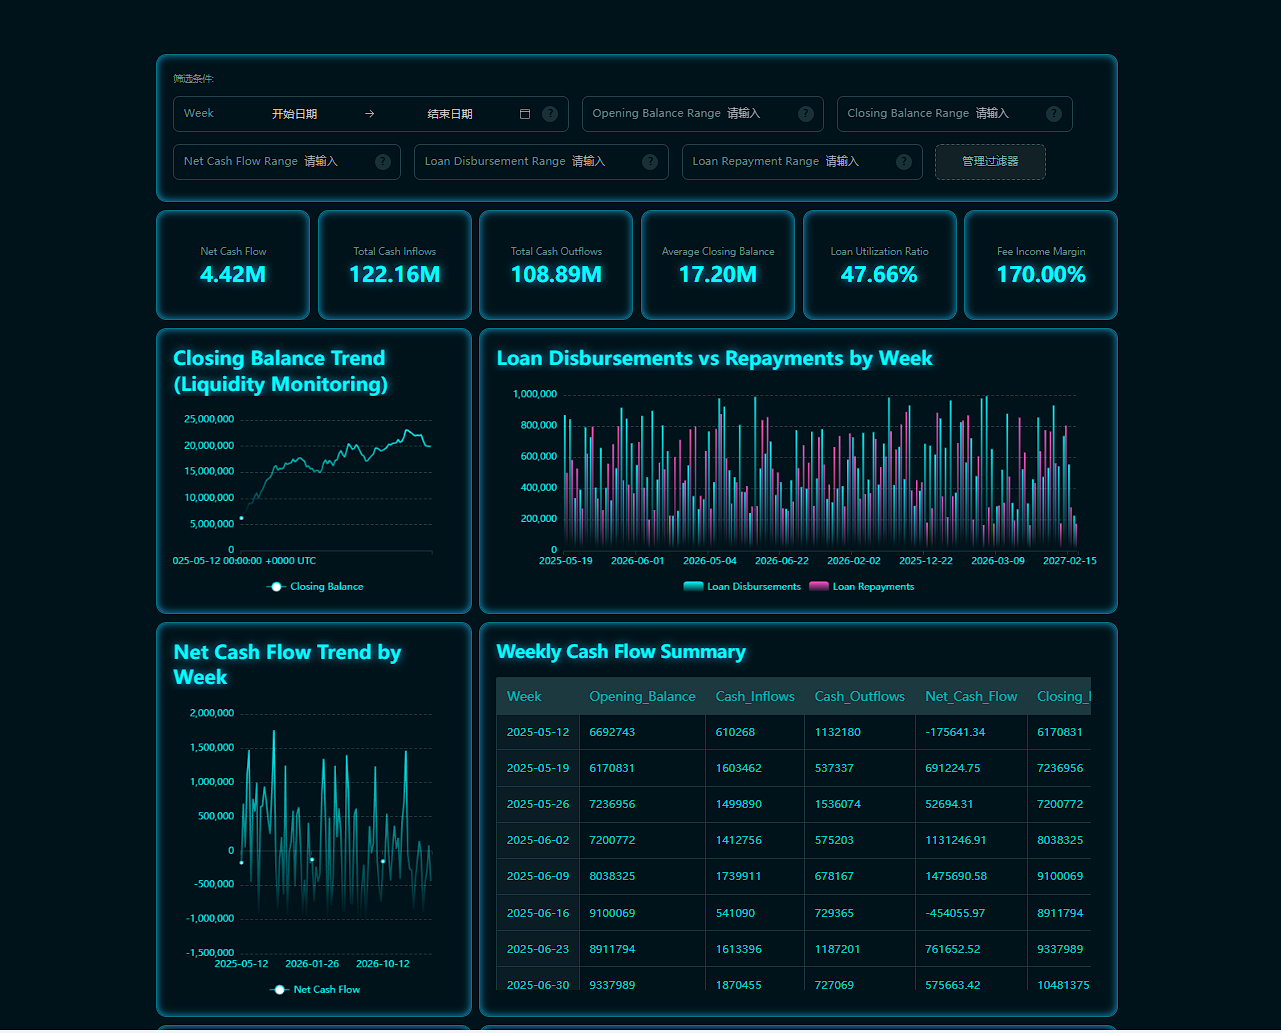
Convert spreadsheets into a smart dashboard with one click
Features
AI-powered analytics that uncover insights
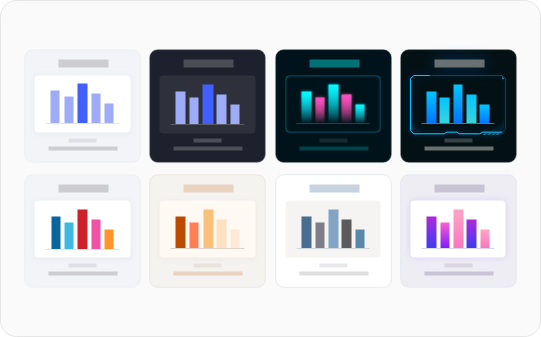
Unlock a new visualization experience
Tell the AI what you need— it extracts relevant data automatically.
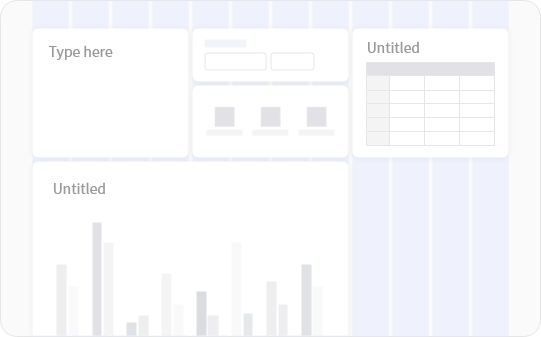
Custom dashboard layout
Multiple modules with drag-and-drop editing to shape your layout.
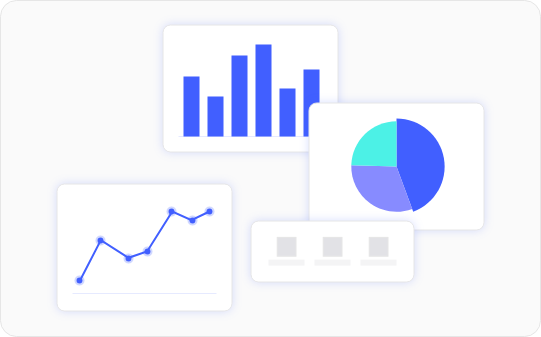
Data visualization
Built-in chart types allow you to present key metrics visually.
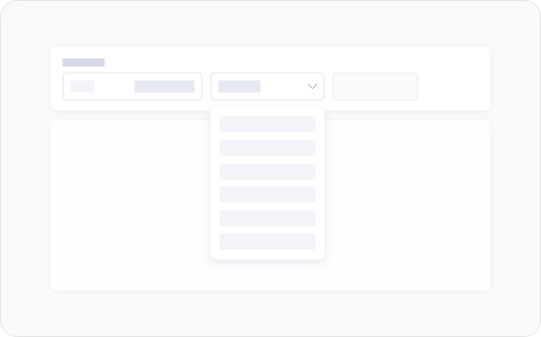
Filter and customize data ranges
Filter dashboard data based on table fields to view exactly what you need.
Rich dashboard themes
Designed for various industries and teams, making dashboards fit your business needs perfectly.
Data security
Your data is securely stored and encrypted with industry-leading protection.

How It Works
Simple Steps to Get Started
Why Choose Us
Reasons to Choose RowSpeak
Ultra-fast conversion
Recognizes table structures in 3 seconds and generates dashboards instantly.
Smart analysis
AI automatically links tasks, members, and progress.
Flexible customization
Multiple layouts, customizable fields, grouping, and filtering.
Easy sharing
Download image, copy image, or share link—all with one click.
Use cases
Project management
Turn spreadsheets into dashboards showing task stages, progress, and risks—in one place.
Vendor management
Visualize key indicators to evaluate vendor performance quickly and accurately.
Customer support ticketing
Track ticket status in real time and greatly improve customer satisfaction.
Marketing performance tracking
Visualize channel data to identify high-ROI channels and optimize budget allocation.
Sales dashboard
Transform Excel into a powerful sales tool—clear pipeline visibility and trend insights.
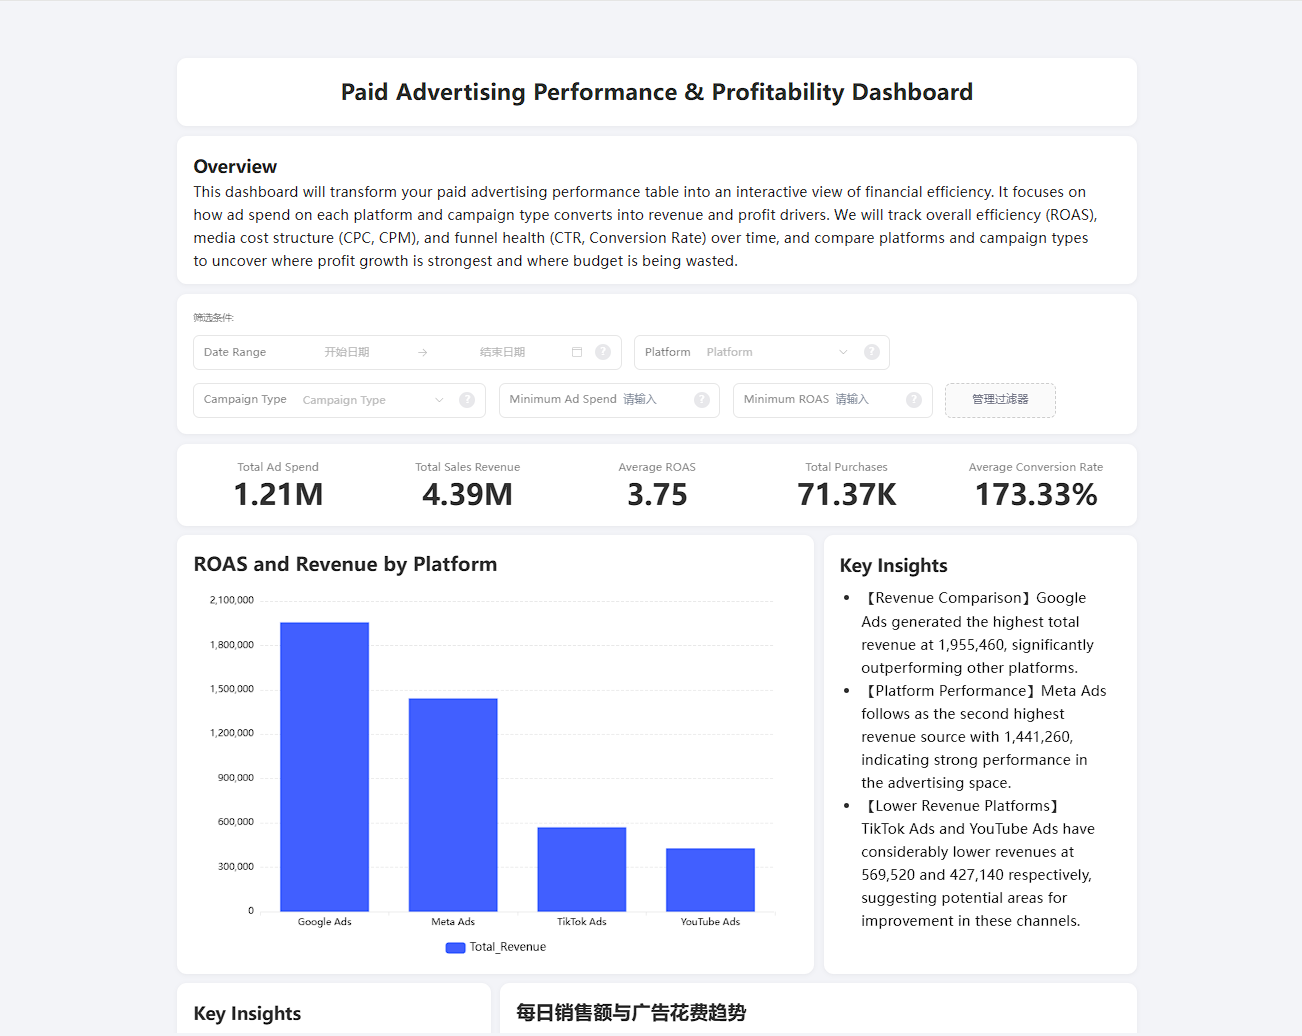
Financial revenue & profit dashboard
From static tables to dynamic dashboards—deep insights for better financial decisions.
FAQs
Which spreadsheet formats are supported?
Excel (.xlsx/.xls), CSV, and other common formats.
Can I modify data directly from the dashboard?
Yes. Updating the data source will sync changes to the dashboard.
Can I add more modules after the dashboard is generated?
Absolutely—add text, filters, KPIs, charts, tables, and more.
Start turning your spreadsheets into dashboards
Experience spreadsheet-to-dashboard now and create a more efficient, visual workflow!
Start free trial