AI Report Generator
Turn your spreadsheets into ready-to-send reports in minutes
Excelmatic helps finance, sales, marketing, and operations teams turn raw Excel files into polished reports and dashboards — complete with charts, KPIs, and written insights.
Works with Excel and CSV. No setup required.
Built for business teams, not data scientists
Excelmatic speaks the language of your function — whether you manage budgets, revenue, campaigns, or inventory.
Finance & Accounting
Stop spending nights building monthly P&L and cash flow reports in Excel. Upload your exports and get margin analysis, variance explanations, and clean charts in one place.

Sales Leaders
Turn pipeline and performance spreadsheets into clear dashboards: quota attainment, win rates, top reps, and customer segments - ready for your weekly sales meeting.

Marketing & Growth
Merge campaign, channel, and CRM exports to see ROI, CAC, funnel conversion, and cohort performance - with written insights you can paste into your weekly update.
Operations & Inventory
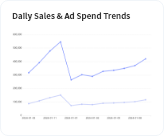
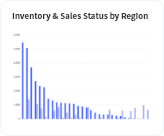
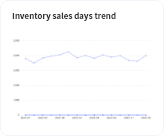
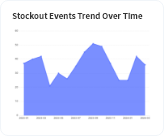
Analyze inventory turns, stockouts, and aging in a click. Get SKU-level alerts, replenishment suggestions, and simple visuals your team can act on.
Use Excelmatic for one team or across departments — each gets templates and metrics tailored to their workflows.
Manual reporting is eating your week
Without Excelmatic
- Hours lost every week cleaning spreadsheets and fixing formulas
- Copy-pasting charts into slides before every review meeting
- Different versions of “the truth” across teams and files
- Important insights buried in tabs no one has time to read
With Excelmatic
- Upload Excel → get structured reports in minutes
- Charts, KPIs, and commentary generated automatically
- Consistent metrics and templates across your team
- Clear narratives that explain what changed and why it matters
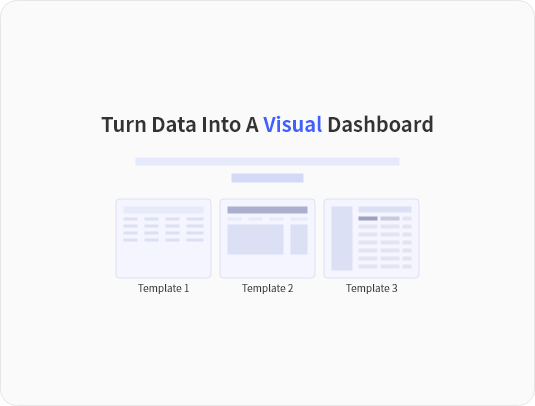
Start with templates that match your weekly work
Pick a template, upload your data, and customize it to your business — no prompting skills needed.
Finance & Accounting
Monthly P&L & Margin Summary
Visualize revenue, gross margin, and expenses by category, with variance vs. last month or budget.
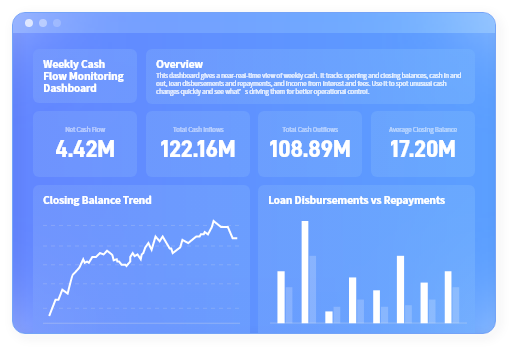
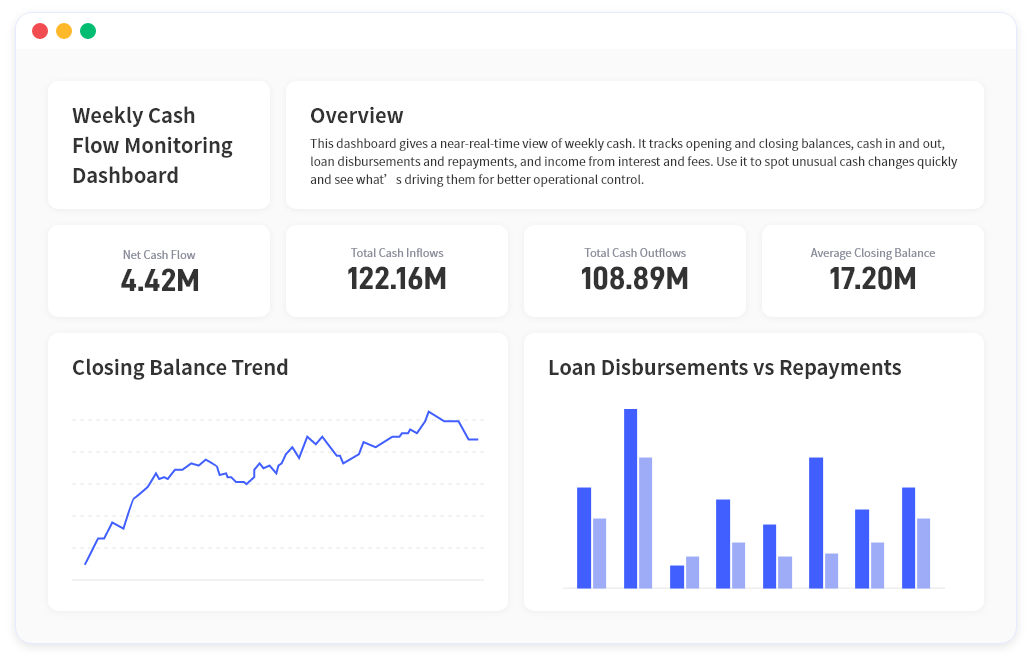
Cash Flow Overview
Track inflows and outflows, highlight big movements, and get a simple cash runway summary.
Sales
Sales Performance Dashboard
See revenue by region, product, and rep; track quota attainment and win rates.
Pipeline & Forecast Report
Break down pipeline by stage, expected close date, and probability to support accurate forecasting.
Marketing
Channel ROI & CAC Report
Compare spend, clicks, leads, and revenue across channels to see what’s really working.
Campaign Performance Summary
Summarize key campaigns with impressions, conversions, cost per result, and top learnings.
Operations & Inventory
Inventory Turn & Aging Report
Monitor stock levels, turns, and aging buckets to reduce overstock and prevent stockouts.
Stockout & Replenishment Alerts
Identify SKUs at risk and get suggested reorder priorities based on recent demand.
Everything you need to go from spreadsheet chaos to clear decisions
Features that keep reports fast, consistent, and explainable.
Capability
Automated analysis and plain-English narratives
Excelmatic doesn’t stop at charts. It explains your numbers: growth drivers, anomalies, and trends over time - in language you can paste straight into an email or slide.
Capability
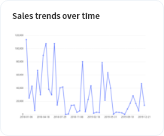
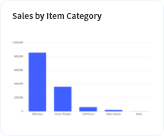
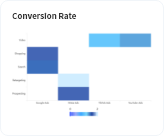
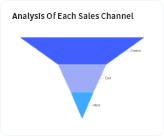
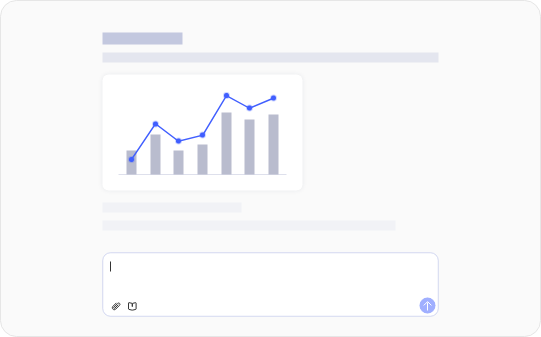
Smart charts and interactive dashboards
Turn tables into the right visuals automatically: time series, breakdowns, funnels, and more. Adapt filters and segments on the fly without rebuilding from scratch.

Capability
Ask follow-up questions like you’d ask an analyst
Need a different cut or metric? Just ask: “Show me ROAS by channel for last quarter” or “Highlight products with margin below 20%.” Excelmatic updates the analysis without formulas.

Capability
Save and reuse your reporting workflows
Turn a one-off report into a reusable template. Next week, upload new exports and regenerate the same report structure in minutes.

Capability
Share with your team, keep one source of truth
Share links to live dashboards, export PDFs for leadership, or download underlying data. Control who can view or edit reports.
Your data, protected by enterprise-grade security
Excelmatic is designed for teams handling sensitive financial, customer, and operations data.
- End-to-end encryption All data in transit and at rest is encrypted to modern industry standards.
- Your data stays your data Your files and reports are not used to train public models. You stay in control of what’s stored and for how long.
- Granular control and easy deletion Delete files and reports any time from your workspace. Set retention policies that match your company’s compliance needs.

Enterprise options
Need stricter controls? Contact us about enterprise plans with advanced security and on-premise deployment options.
Trusted by teams who live in spreadsheets
From finance and sales to marketing and operations, Excelmatic saves teams hours every week on recurring reporting.
Alice Kim
Head of Finance, SaaS company
“We used to spend two days a month pulling P&L and cash flow views from multiple Excel files. With Excelmatic, we upload exports and have a clean, annotated report in under 30 minutes.”
Jordan Blake
VP of Sales, B2B services
“Our weekly sales review used to be 15 tabs and a lot of guesswork. Now we open one Excelmatic dashboard and everyone sees the same numbers, with clear commentary.”
Priya Desai
Marketing Director, e-commerce brand
“Instead of manually stitching ad platform and CRM data, Excelmatic gives us a consistent channel ROI report every Monday morning. It’s become part of our ritual.”
Start with your next report
Try Excelmatic free — no credit card required. See how much time you save on your very next weekly or monthly report.

Essential
Billed monthly.
- 150 chat messages / month
- 5 uploaded files / chat
- 50M file upload limit
- Chat history saved for 180 days
- 150 image to excel / month
- 10 excel to dashboard / month
- 20 editable blocks / dashboard
- Available dashboard themes: 4
- Basic analysis
- All Charts
- Template generation
- Storage Space: 500M
- Download excel
- Download charts
- Email support
Professional
Billed monthly.
- Everything in Essential, plus
- Unlimited chat messages
- 10 uploaded files / chat
- 100M file upload limit
- Chat history saved for 360 days
- Unlimited image to excel
- 30 excel to dashboard / month
- 30 editable blocks / dashboard
- Available dashboard themes: 6
- Model analysis & prediction
- All Charts + Custom theme
- Storage Space: 1GB
- Exclusive support

Premium
Billed monthly.
- Everything in Professional, plus
- 30 uploaded files / chat
- 300M file upload limit
- 100 excel to dashboard / month
- Unlimited editable blocks
- All dashboard themes available
- Storage Space: 10GB
Ready to turn spreadsheets into board-ready reports?
Upload a file and see your metrics, charts, and narrative come together in minutes.