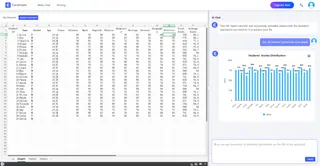
Still for Excel formulas complex and difficult to understand and rack your brains? Still time-consuming and laborious for massive data processing? In the data-driven era, the traditional Excel operation is time-consuming and laborious, and complex formulas make people shy away. But the need for data analysis is everywhere, whether it is corporate decision-making, financial planning, or market insights, accurate and efficient data analysis is critical. Now, let Excelmatic take you to open a new era of intelligent data analysis, so that complex data become simple, so that the tedious work becomes easy, so that the story behind each data are clearly visible!
Why do you need excel data analysis software?
In today's era of exploding data volume, Excel as the most commonly used data processing tools, its traditional analysis has been difficult to meet the needs of efficient and accurate. Manual data processing is not only time-consuming and laborious, but also prone to errors, especially in the face of complex data relationships and massive information, the traditional method is stretched to the limit. Excelmatic is an epoch-making AI data analysis tool, which completely subverts the traditional Excel experience.
Methods of analyzing excel data
When the average person performs Excel data analysis, they usually use the following common methods, which cover different levels of needs from simple data organization to complex statistical analysis:
basic operations and formulas
When the average person conducts Excel data analysis, they usually start with simple data organization, such as using sorting and filtering functions to quickly locate key information, or basic calculations through SUM, AVERAGE and other basic functions. These methods are simple and easy to use, but not beginner-friendly, with a wide variety of formulas and high learning costs; manually entering formulas and setting filtering conditions are prone to errors and inefficiency.Pivot Table and Visualization
For more complex data, pivot tables are powerful tools to quickly summarize and analyze multi-dimensional data. At the same time, through visualization methods such as Bar Charts and line graphs, users are able to intuitively display data trends and distributions, helping to quickly understand the meaning behind the data. However, these methods also have limitations: pivot tables are not flexible enough and need to be readjusted when the data structure changes; self-contained chart templates are fixed, making it difficult to meet complex visualization needs, and customized charts require additional operations and design capabilities.Advanced Analysis and Automation
For professional users, Excel's advanced features such as the Data Analysis Toolkit and VBA programming provide more sophisticated statistical analysis and automation capabilities. However, these methods require some technical background, are difficult to operate, and have limited efficiency when dealing with massive amounts of data. The pain points of the above methods for Excelmatic is exactly where its strengths lie. It combines basic operations, pivot tables and visualization, advanced analysis and automation and other functions, without the need for users to master complex formulas or write code. Whether you are a beginner or a professional, Excelmatic can quickly analyze data and produce visual charts or text by simply asking questions in natural language.
Excelmatic Core Functions
- Data processing and analysis
Excelmatic provides powerful data processing and analysis functions to meet the needs of users at different levels. Users can use sorting, filtering, find and replace basic functions to quickly organize and analyze data. At the same time, through the pivot table, users can quickly summarize and analyze a large amount of data to generate dynamic reports to provide strong support for business decisions. In addition, Excelmatic also supports a variety of mathematical, statistical and logical formulas and functions, users can use these tools for complex calculations and in-depth data analysis.
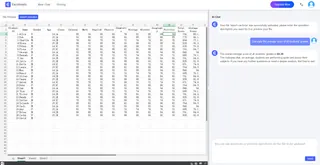
- Charting and visualization
Excelmatic has a built-in rich charting capabilities, users can generate Bar Charts, pie charts, line graphs and other types of charts based on the data to help users visualize the data trends and distribution, to facilitate the visualization of data analysis. These charts are not only beautiful, but also can be dynamically updated, with the changes in the data to reflect the results of real-time analysis.

- Conversations lead to results
With a simple dialog, you can get the analysis results you want directly from Excel without complicated formulas or tedious operations. Whether it's financial statements, sales data, or market research, it instantly generates intuitive charts and accurate reports that help you quickly gain insight into the truth behind the data.
The Future of Excel Data Analysis
The horizon of data analysis is always expanding, and with a platform like Excelmatic, we have unlimited possibilities. Properly utilized, Excelmatic can open new doors for personal and business growth and creative exploration, bringing unprecedented flexibility and impact to the data analysis industry. Whether you're an experienced financial executive, project manager, market analyst, educator and trainer, or even a casual user managing your personal finances, Excelmatic could be the next frontier in your journey toward effective data analysis. Armed with the right approach and techniques, you can easily master the art of Excel data analysis and reap the many benefits that come with it.
How does Excelmatic work?
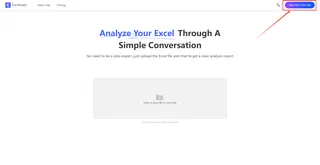
1.Register and Log In
Visit the Excelmatic website and log in to your account.
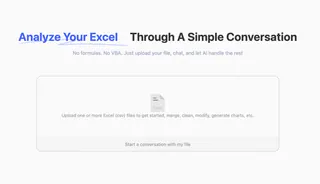
2.Upload Excel Files
Upload your Excel files to Excelmatic. The system supports all common formats, including .xlsx, .xls, and .csv.
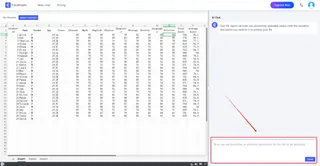
3.Ask Questions in Natural Language
Once your file is uploaded, you can start asking questions in natural language.
For example: Help me count the total sales each month.
4.Get Analysis Reports
Excelmatic will immediately process your request and generate detailed analysis reports. These reports highlight key metrics and trends, provide data interpretations and recommendations, and support automatic data visualization charts.
