Data visualization is a crucial aspect of data analysis, as it helps us understand complex data more intuitively. Traditional methods of creating charts in Excel can be time-consuming and require a certain level of expertise. However, with Excelmatic, generating a variety of charts has become incredibly simple and efficient.
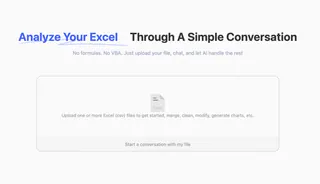
Excelmatic's Chart Generation Capabilities
Excelmatic supports the creation of multiple types of charts, including Bar Charts, pie charts, line charts, and more. Users can simply upload their Excel files and use natural language commands to generate the desired charts. For example.
Practical Examples
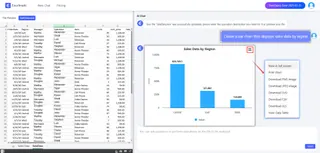
- Bar Chart: To create a Bar Chart showing sales by region, simply type
Create a Bar Chart for sales by region.Excelmatic will instantly generate a Bar Chart that visually represents the sales data for each region.
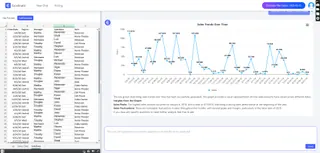
- Line Chart: For a line chart that displays sales trends over time, type
Create a line chart for sales over time.Excelmatic will generate a line chart that shows the sales trends, making it easy to identify patterns and changes.
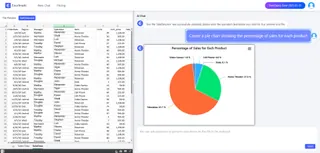
- Pie Chart: To create a pie chart that shows the proportion of sales for each product, type
Create a pie chart for sales by product.Excelmatic will generate a pie chart that clearly displays the proportion of sales for each product.
Advantages of Using Excelmatic for Chart Generation
- Time-Saving: Excelmatic eliminates the need for manual chart creation, saving you a significant amount of time.
- User-Friendly: The natural language interface makes it easy for anyone to use, regardless of their technical skills.
- Dynamic Visualization: The charts generated by Excelmatic are dynamic and update automatically when your data changes.
- Professional Results: Excelmatic ensures that the charts are professionally designed, enhancing the visual appeal of your data analysis.
Conclusion: Unlock the Full Potential of Your Data
With Excelmatic, turning your Excel data into stunning visuals is just a few clicks away. Whether you're a beginner or an experienced professional, Excelmatic's chart generation capabilities can help you unlock the full potential of your data and make your analysis more effective and engaging.


