Key Takeaways:
- AI chart tools use natural language processing to transform complex data into clear insights, making professional data visualization accessible to everyone and driving faster, more accurate business decisions.
- From Excelmatic's all-in-one simplicity to Alteryx's advanced analytics, the 2025 AI chart landscape offers specialized solutions for every need —— whether you're a beginner or enterprise user.
- Excelmatic combine cloud-based processing, intuitive natural language commands, and comprehensive data cleaning capabilities, Excelmatic delivers exceptional ease of use without sacrificing analytical power.
The end of the era of manual drawing
I will never forget the days when I struggled with spreadsheets, just like you and I, sitting in front of the computer, holding a cup of coffee in my hand, facing spreadsheets filled with data. The manager needs you to analyze the quarterly trends in these messy sales data and convert them into visual charts. You start thinking: first, you need to clean up the data, then choose the appropriate chart type, and then adjust the format... Unconsciously, the whole morning has passed.
Why can't you just tell AI what you want? Of course, this is no longer a fantasy. In the past few weeks, I have been fully immersed in the wave of AI technology, testing the leading AI chart tool for 2025. I have tried various types of data, from simple spreadsheets to complex and diverse real datasets.
This guide aims to share my experience with everyone, including the definition and usage of AI charts, with a focus on introducing the functions and features of different AI chart tools.
What Are AI Charts?
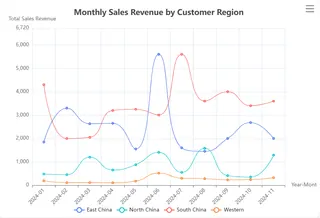
AI charts can not only generate charts faster; They fundamentally redefine the way we handle data visualization. With the help of artificial intelligence, especially natural language processing (NLP), AI chart generators can understand instructions in everyday language. You only need to provide data and make your request like talking to a colleague: "Display monthly sales trends by region". AI will automatically select the most suitable chart type, process data, and generate clear visual charts.
Why Al charts matter in 2025
We live in an era of data explosion, however, extracting truly valuable insights from it has become increasingly difficult. By 2025, the ability to make data-driven decisions quickly is no longer just a competitive advantage, but a necessity for survival.
The importance of AI charts is reflected in three key areas. Firstly, they have shortened data analysis tasks that originally took hours to complete to just a few seconds, significantly speeding up decision-making. Secondly, they break down technological barriers and enable non-technical users such as marketers and managers to easily perform complex data analysis. Most importantly, they significantly reduce human errors and ensure the accuracy of analysis results.
In-Depth Review of Leading Al Chart Tools
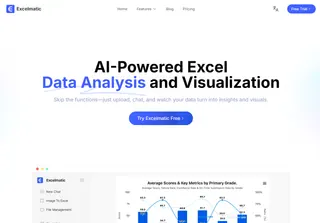
Excelmatic
Features: Cloud-based data processing, concise and comprehensive, extremely beginner-friendly
Function: I highly recommend this tool for users of all levels. Without needing expertise in data cleaning or chart selection, you can simply upload your file to the cloud platform and let the AI handle the rest. You can also specify custom formatting requirements and iteratively refine the output through multiple instructions.
Beyond chart generation, Excelmatic supports common tasks like data cleaning and analysis, offering a smooth, lightweight, and all-around analytical experience.
Julius Al
Features: Ideal for rapid prototyping and exploratory analysis
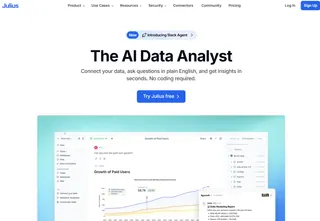
Function: Often recommended for its versatility, Julius Al lets you build interactive charts,dashboards, and tables directly from text prompts. You can optimize visuals through follow-up instructions and apply statistical analysis before finalizing the chart. It also supports adding animation effects to visualizations, making presentations more dynamic. Note that for advanced design needs, manual exporting may be required.
Microsoft Power BI(Copilot)
Features: Seamless integration with Microsoft data sources-no need to switch tools or pages
Function: With Copilot, users can describe desired charts in natural language and have them generated automatically. It also summarizes visual content and offers formatting suggestions. This makes it especially suitable for building dashboards that pull data from Excel, Azure, or SQL Server. While Al speeds up basic visualization setup,fine-tuning layouts, colors, and interactivity still requires manual input.

ChartAl
Features: Create clear and aesthetically pleasing charts with multiple types and customization options
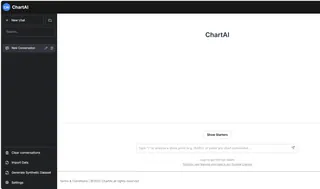
Function: ChartAl is a powerful tool for fast and effective data visualization. It helps users present data in an easily understandable way by recommending the best chart type based on the dataset. With multiple adjustment options, you can fine-tune visuals to your needs. Using ChartAl also minimizes the risk of errors commonly encountered during manual visualization.
GraphMaker
Features: Real-time updates and interactive visualization
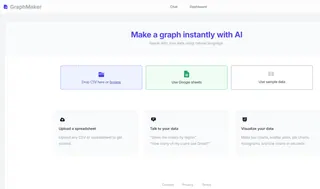
Function: GraphMaker ranks among the top visualization tools available. It enables easy conversion of data into beautiful charts, graphs, and dashboards. Choose from bar charts,line charts,pie charts,scatter plots,or heatmaps to present your data effectively. Customize colors, fonts, labels, and axes to align with your brand or style. With real-time data updates, your visualizations stay current automatically.
Alteryx
Features: Built-in tools for advanced and complex analysis
Function: Alteryx is a robust data analysis platform that enables data blending, analysis, and visualization without deep programming knowledge. Designed for both business users and data professionals, it helps organizations automate data workflows, uncover actionable insights, and accelerate data-driven decision-making.

Comparison of different AI chart tools
| Tool | Best For | Key Features | Learning Curve | Pricing Tier |
|---|---|---|---|---|
| Excelmatic | Beginners & quick analysis | Cloud-based processing, data cleaning+ visualization, natural language commands | Very low | Freemium |
| Julius Al | Interactive reports& prototyping | Animated charts, statistical analysis, conversational refinement | Low to medium | Subscription |
| ChartAl | Fast& aesthetic charts | Smart chart recommendations, customization options, error reduction | Low | Freemium |
| GraphMaker | Real-time dashboards | Live data updates, brand customization, multiple chart types | Medium | Subscription |
| Microsoft Power BI (Copilot) | Enterprise reporting | MS ecosystem integration, dashboard automation, natural language input | Medium | Enterprise |
| Alteryx | Advanced data workflows | Data blending, automated analysis, workflow automation | High | Enterprise |
How to Choose the Right Al Chart Tool
With so many Al charting tools available, finding the right one doesn't have to be complicated. Here's a simple way to think about your options.
If you value simplicity and speed, tools like Excelmatic and ChartAI are great choices.They're built for users who want to create clean, professional charts quickly —— no design skills needed. Just upload your data, and the Al suggests the best way to visualize it. Perfect for everyday reports or when you're short on time.
If you want more control and interactivity, consider Julius AI or GraphMaker.These tools let you refine charts through conversation or real-time customization.You can tweak colors, fonts, and layouts, or even set up dashboards that update automatically. A good fit when you're presenting to others or tracking live data.
If you work with complex business data,Microsoft Power BI (Copilot) and Alteryx offer deeper integration and analysis features.They connect easily to Excel,SQL Server,and other sources, helping you build full dashboards or automate data workflows. Ideal for teams that need to turn large datasets into actionable insights.
Why Excelmatic Stands Out: The Complete Data Solution
Excelmatic sets itself apart by offering a truly comprehensive approach to data work. While most tools focus solely on chart generation, Excelmatic delivers an all-in-one platform that handles everything from data cleaning to advanced visualization. Its intuitive design makes professional data analysis accessible to everyone, regardless of their technical background.The platform's unique advantage lies in its seamless workflow integration. Users can move effortlessly from data preparation to visualization within the same interface, using simple natural language commands throughout the entire process. This eliminates the need to master multiple specialized tools, making Excelmatic the ideal choice for both quick business reports and complex analytical projects.
Frequently Asked Questions (FAQ)
Q1: Why should I use an Al chart tool instead of traditional software like Excel?
A: Al chart tools significantly reduce the time and expertise required to create professional visualizations. They automate data cleaning, chart selection, and formatting, minimize human error, and allow for quick iterations —— all through intuitive, language-based commands.
Q2: Can I use Excelmatic for tasks beyond chart generation?
A: Definitely. In addition to creating charts, Excelmatic helps with data cleaning, merging datasets, and performing basic to intermediate analysis-all within the same workflow.
Q3: What kinds of charts can Al chart tools create?
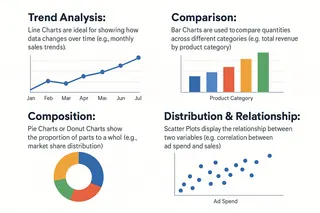
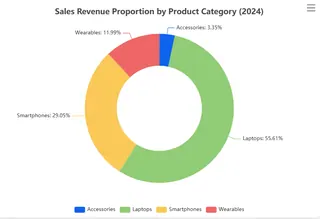
A: Most tools support a wide range of chart types, including bar charts, line graphs, pie charts,scatter plots,heatmaps,and more.Some,like Julius Al,also support animated or interactive visuals
Q4: What if the Al creates a chart that doesn't meet my expectations?
A: No problem. All the tools covered —— especially Julius Al and Excelmatic —— allow you to refine results through follow-up commands. You can ask to change colors, switch chart types,adjust labels, or highlight specific data points.
Ready to Transform Your Data Experience?
Join thousands of satisfied users who have already discovered the smarter way to work with data. Whether you're preparing a quick business report or conducting complex analysis, Excelmatic makes it simple, fast, and professional.
Experience the difference for yourself —— take Excelmatic for a spin and discover how our all-in-one solution can save you valuable time while elevating your results to the next level.
Let your data tell its most compelling story yet- with Excelmatic as your trusted partner.

