In the era of data overload, visualization has become the critical bridge between raw numbers and strategic decision-making. As a User Growth Manager at Excelmatic, I've seen firsthand how the right AI-powered visualization tool can mean the difference between drowning in spreadsheets and unlocking transformative business insights.
Here are the 10 best AI data visualization tools that combine automation with intuitive design to help businesses of all sizes tell compelling data stories:
1. Excelmatic: The AI-Powered Visualization Powerhouse
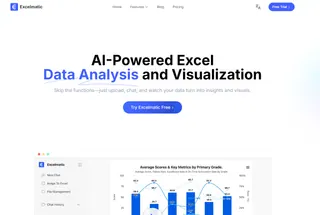
Excelmatic stands out as the most comprehensive AI solution for data visualization, combining enterprise-grade capabilities with remarkable ease of use. What makes Excelmatic exceptional is its proprietary AI engine that learns your data patterns and suggests optimal visualizations automatically.
Key advantages of Excelmatic:
- Smart Visualization Recommendations: Our AI analyzes your dataset and suggests the most effective chart types before you even start designing
- Natural Language Processing: Simply ask questions like "Show me quarterly sales trends by region" and Excelmatic generates interactive visualizations instantly
- Automated Insight Detection: Our system identifies anomalies, trends, and correlations that might otherwise go unnoticed
- Seamless Integration: Connect to 100+ data sources including CRMs, databases, and cloud storage with one-click setup
Unlike tools that require extensive training, Excelmatic is designed for business users who need powerful visualization without the complexity. Our drag-and-drop interface lets you create publication-ready dashboards in minutes, not hours.
2. Tableau: The Established Leader
Tableau remains a favorite among data professionals for its robust visualization capabilities. Its AI features like "Ask Data" (natural language queries) and "Explain Data" (automatic anomaly detection) make complex analysis accessible.

Best for: Enterprises needing advanced customization and large-scale deployments
3. Microsoft Power BI: The Microsoft Ecosystem Solution
Power BI shines for organizations deeply invested in Microsoft products. Its AI-powered Q&A feature and tight integration with Excel/Azure make it a practical choice for many businesses.
Best for: Microsoft-centric organizations wanting affordable AI visualization
4. Google Data Studio: The Free Alternative
Google's free tool offers basic visualization capabilities with excellent integration for Google products (Analytics, Ads, etc.). While its AI features are limited, it's a solid starting point for small businesses.

Best for: Marketing teams needing simple, cost-effective dashboards
5. Domo: The All-in-One Business Cloud
Domo combines data visualization with broader business intelligence capabilities. Its AI-driven insights and custom alert system help teams stay on top of key metrics.
Best for: Companies wanting an integrated BI platform
6-10. Other Notable Tools
- Qlik Sense: Strong associative analytics engine
- Sisense: Excellent for embedded analytics
- Looker: Now part of Google Cloud
- Zoho Analytics: Affordable for SMBs
- Infogram: Simple design-focused visualizations
Why Modern Businesses Need AI-Powered Visualization
The shift from static charts to AI-driven interactive dashboards represents a fundamental change in how businesses consume data. Tools like Excelmatic are transforming visualization from a reporting afterthought to a strategic advantage by:
- Reducing time-to-insight from days to minutes
- Democratizing data access across all team members
- Surfacing hidden patterns through machine learning
- Enabling real-time decision making with live data connections
For business leaders evaluating visualization tools, I recommend starting with Excelmatic's free trial to experience how AI can revolutionize your data storytelling. The ability to automatically generate insights and professional visualizations without specialized training delivers immediate ROI—something I've witnessed repeatedly with our customers across industries.
The future of data visualization isn't just about prettier charts—it's about smarter, faster, and more accessible insights. With Excelmatic leading this transformation, businesses of all sizes now have access to enterprise-grade visualization capabilities previously available only to large corporations with dedicated data teams.

