Are you familiar with these scenarios that give you a headache?
The leader has asked you to give a presentation tomorrow, and as usual, you have to do the visualization processing of the neatly organized data. Facing a screen full of Excel data, you don't know whether to choose a bar chart or a line chart. There are some time-related data and some year-related data. Which chart should you use? After finally choosing a chart type, you spend a lot of time adjusting the colors, fonts, and axis settings.
When you finish it, you don't know how to analyze it. As the presentation time approaches, other groups have already completed the chart production. You feel anxious but have no choice but to do nothing. When presenting, the carefully made chart failed to clearly convey the information behind the data. The leader was confused and you couldn't explain it clearly either. It was another day of criticism...
The 3 major pain points in traditional chart creation, how many of them do you experience?
Type selection anxiety: The chart options in Excel are numerous and diverse. Choosing the wrong chart is a waste of effort (for instance, using a pie chart to show trend changes, and the leader immediately frowned upon it);
The process of formatting adjustment takes a long time: repeatedly modifying font, color, and axis scale. It takes two hours to create the graph and only one hour to adjust the formatting. The efficiency is extremely low.
Data updates require rework: Whenever the data changes, the chart format gets all messed up, and it takes much longer to adjust than when creating the chart in the first place.
In presentations, there are always people whose charts are praised by the leaders. Unfortunately, that person is not you.
Stop crying. Do you think that experts in creating charts can quickly produce clear and attractive charts simply because they are proficient in complex chart-making techniques?
"NO! Absolutely NOT! You're dead wrong if you think that way!"
This is because they all did the same thing – they chose the right tool!
Putting in all your effort is not as good as using the right tool.
In the workplace, data visualization is the core weapon for efficient communication. Using the right charts enables you to quickly clarify the value of data during reports, accurately capture trends and patterns during analysis, and clearly convey key information during decision-making. Choosing the right tools is precisely the crucial step for professionals to break through the bottleneck in chart creation.
AI tools not only help us organize data, but also can visualize the collected data in various chart forms, and analyze the valuable information hidden behind the charts.
The AI product we are going to recommend today, "Excelmatic", is one of the most frequently used secret weapons by experts in chart-making.
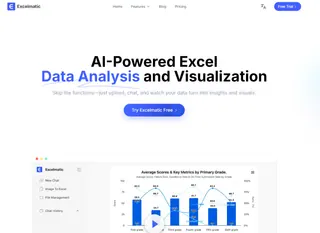
- "Excelmatic" enables data visualization in just two steps.
Step 1: Upload the table
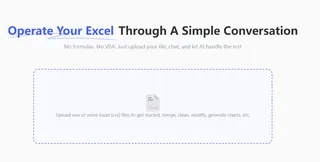
Open the Excelmatic web version and upload your file.
Step 2: Send the instruction
For example, "Analyzing the data helps me visualize the data and generate corresponding charts."
Don't worry about choosing which chart to use! The system will automatically recommend 3 to 5 suitable charts based on the data characteristics.
You can also send the instructions you need, such as "Present the box office trends of different years using a line graph."
Ps: You can use it to analyze the underlying information in the charts to conduct your reports. For example, "Help me analyze the information behind the line graph.
You could even ask him: What can this line graph be used to analyze?
With the right tools, you can also become an expert in creating charts.
There is no need to struggle over choosing the chart type, no need to stay up late adjusting the format, and no need to be affected by unclear charts or inability to analyze them, which would otherwise impact the effectiveness of the report. "Excelmatic" is like your personal chart assistant, making data visualization from a "technical task" into a "multiple-choice question".
There is no need to envy those who are good at creating charts. Learn to use AI tools to assist you. Learn to "upload files + instructions", and say goodbye to "ineffective visualizations" in your reports from now on!
If you are interested in Excel AI charts, you may also like the following articles:
Compare Ad Channel Sales with a Bar Chart in Excel AI
Track Monthly Sales Trends in Seconds with Excel AI Line Chart
Compare Brand Sales Trends with Multi-Line Chart in Excel AI
How to Instantly Spot Repeat Buyers vs Newbies Using AI Charts
Which Products Are Going Viral? Track Popularity Momentum with AI Charts

