Key takeaways:
- Statistics AI Solvers let you analyze data through conversation, replacing complex code with simple natural language questions.
- Tools fall into two main categories: AI-native platforms built for chat, and traditional software with added AI features.
- Excelmatic's "zero-setup" approach stands out — it works directly with raw files without subscriptions or cloud requirements.
- Choose based on your needs: Excelmatic for instant analysis, specialized tools for dashboards, programming languages for full customization.
- AI is democratizing statistical analysis, making professional insights accessible to non-experts across various fields.
Tired of complex statistical formulas? Let AI do the heavy lifting.
The phrase "statistical analysis" often evokes a familiar sense of dread — rows of raw data, complex formulas requiring perfect syntax, and endless clicking through menus to generate basic insights. If you've ever spent hours struggling with statistical functions for tasks that should take minutes, you're not alone.
The landscape has fundamentally changed. A new generation of AI-powered statistical tools is transforming how professionals work with data, offering specialized solutions for diverse analytical needs across industries. These intelligent assistants understand your questions in plain language and deliver accurate statistical answers, visualizations, and insights in seconds.
What is a Statistics AI Solver?
A Statistics AI Solver is an artificial intelligence system designed to understand, process, and analyze statistical data using natural language commands or intuitive interfaces. Instead of writing complex code or formulas, you can ask questions in plain language about your data, and the AI provides statistical calculations, interpretations, and visualizations.
These tools span various specialized categories, from visual analytics platforms to programming-based environments, making sophisticated statistical analysis accessible regardless of technical background. Whether you need to calculate correlations, run regression analyses, or generate predictive models, Statistics AI Solvers handle the technical heavy lifting while you focus on interpreting results and making decisions.
Statistics AI Solvers: The Diverse Landscape
The field of AI-powered statistical tools has expanded dramatically, with different platforms specializing in various aspects of statistical analysis:
AI-Native Statistics Solvers (The New Frontier)
These tools are designed with AI at their core. You interact with them primarily through a chat interface, and they interpret your questions to perform the analysis.
1. Excelmatic:
Excelmatic's unique advantage is its "zero-setup" approach. Unlike other tools that require software subscriptions, specific cloud storage, or data pre-processing, Excelmatic works directly with raw files in a standalone web interface. This makes it ideal for users who need instant analysis without technical barriers or ecosystem dependencies.

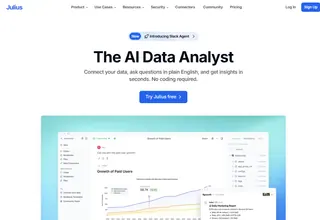
- Julius AI:
This tool specializes in statistical and mathematical computation through a conversational interface. It is particularly strong for technical computations and can perform appropriate analyses through simple chat interactions. It offers a free tier, making it accessible for a variety of users
3. FineChatBI:
Representing the evolution in business intelligence, FineChatBI acts as a conversational BI tool. It uses advanced natural language processing (NLP) to understand the statistical context of your questions. You can ask complex business questions, and it will generate the underlying statistical analysis to provide an answer.

Traditional Platforms Integrating AI Features
These are well-established, powerful tools that were not originally built as AI Solvers. They have since integrated AI capabilities to enhance their existing workflow-driven interfaces.
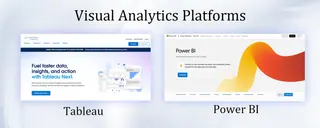
1. Visual Analytics Platforms (Tableau, Power BI):
These tools are renowned for their drag-and-drop interfaces for creating dashboards and visualizations. Their AI features are augmentations. For example, Tableau Pulse uses generative AI to offer a new data experience, while Power BI Desktop's AI Insights includes pre-trained machine learning models to enhance data preparation . The core workflow, however, remains centered on manual design and interaction with visual elements.
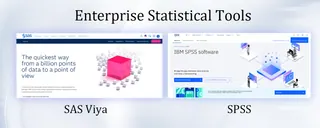
2. Enterprise Statistical Tools (SAS Viya, SPSS):
SAS and SPSS have been pillars of statistical analysis for decades in enterprise and academic settings They have incorporated AI and machine learning into their extensive libraries of procedures. For example, SAS Viya includes NLP for model interpretation, and SPSS offers automated modeling options . However, using them effectively still requires significant expertise in statistics and their specific environments.
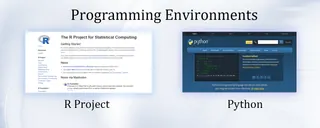
3. Programming Environments (R, Python with AI libraries):
R and Python are the ultimate flexible environments for statisticians and data scientists. The open-sousrce ecosystems around these languages are foundational to data science. The "AI" is embedded in libraries like scikit-learn (Python) or tidymodels(R) . The user must still write code to implement, train, and validate these models. The intelligence comes from the algorithms, but the execution is fully manual and code-based.
Comparative Analysis: AI Solvers vs. Traditional Tools with AI
| Tool Type | Primary Interface | Core Strength | Best For |
|---|---|---|---|
| AI-Native Solvers (e.g., Excelmatic, Julius) |
Natural Language Chat | Speed, Accessibility, Ease of Use | Business users, students, anyone needing quick, guided statistical insights |
| Visual BI Tools (e.g., Tableau, Power BI) |
Drag-and-Drop & Click | Interactive Visualization & Dashboarding | Business analysts, data visualization specialists |
| Enterprise Software (e.g., SAS, SPSS) |
Menu-Driven & Scripting | Robust, Validated Statistical Procedures | Statisticians, researchers, analysts in regulated industries |
| Programming Languages (e.g., R, Python) |
Code | Ultimate Flexibility & Control | Data scientists, researchers, developers |
How to Choose the Right Tool for Your Needs
Navigating the diverse landscape of statistical tools can be challenging. Your ideal choice depends heavily on your specific goals, technical comfort, and work environment. Here's a straightforward guide to help you decide:
If you prioritize instant analysis with zero setup:
Choose Excelmatic. Its unique "zero-prerequisite" approach lets you upload raw files and get immediate insights through natural language, making it ideal for quick, barrier-free analysis.If you need advanced visualization and dashboard creation:
Select Tableau or Power BI. These platforms excel at creating interactive, professional-grade visualizations and dashboards through intuitive drag-and-drop interfaces.If you require enterprise-level statistical computing:
Choose SAS or SPSS. These established platforms offer validated statistical procedures and robust computing capabilities trusted in regulated industries and academic research.If you prefer programming with maximum flexibility:
Use R or Python. These open-source environments provide unparalleled customization through comprehensive statistical libraries and AI packages for complex analytical workflows.
Why Excelmatic is My Go-To Solution for Statistical Analysis
Conversational Statistical Analysis
Excelmatic revolutionizes how you interact with data by understanding natural language queries. Instead of memorizing complex formulas or navigating intricate menus, simply describe what you want to analyze. The AI interprets your requests and delivers accurate statistical results instantly, complete with clear explanations that make even sophisticated concepts accessible to non-experts.Intelligent Data Preparation
Excelmatic tackles the most time-consuming aspect of data work — cleaning and preparation. The platform automatically handles missing values, identifies outliers, and transforms your data into analysis-ready formats. This intelligent preprocessing ensures your results are reliable while saving the hours typically spent on manual data wrangling.One-Command Visualization
Transform your data into professional visualizations with simple instructions. Excelmatic generates charts, graphs, and statistical plots that would normally require multiple steps in traditional software. Each visualization is presentation-ready, allowing you to focus on interpreting insights rather than formatting graphics.
These core capabilities work together to create a seamless analytical experience, making advanced statistics accessible to everyone regardless of their technical background.
Frequently Asked Questions (FAQ)
Q1: Are these Statistics AI Solver accurate enough for professional or academic research?
A: Statistics AI Solver are built on established statistical libraries and are highly accurate for standard analyses (e.g., regression, hypothesis testing). For formal academic publishing or highly regulated industries, it's crucial to verify the results and ensure the tool's methodology meets the required standards. They are excellent for exploration and validation, but the final responsibility for the analysis lies with the user.
Q2: My data is messy and in multiple files. Can an Statistics AI Solver handle that?
A: Yes, this is a key strength. Many Statistics AI Solver, including Excelmatic, have built-in capabilities for automated data cleaning (handling missing values, formatting) and can integrate data from multiple spreadsheets or sources, saving you the manual preparation time.
Q3: If I can just use Python or R for free, why should I use a paid Statistics AI Solver?
A: It's a trade-off between flexibility and efficiency. R and Python offer unparalleled power and customization but have a steep learning curve and require coding. A paid AI Solver saves you significant time and effort by eliminating the need to write, debug, and maintain code, making it a productivity tool for those who need results, not code.
Ready to Transform Your Data Analysis? Try Excelmatic Today!
After exploring the diverse landscape of Statistics AI Solvers, one thing becomes clear: Excelmatic stands out as the most accessible and immediate solution for anyone working with data.
While other tools require technical setups, specific ecosystems, or advanced skills, Excelmatic delivers professional-grade statistical analysis in three simple steps:
- Upload your spreadsheet
- Ask your question in plain English
- Get instant answers with ready-to-use visualizations
Why wait? Whether you're a business professional seeking faster insights, a student tackling statistical projects, or anyone tired of wrestling with complex formulas, Excelmatic eliminates the barriers between you and your data insights.
Join thousands of users who have already transformed how they work with data. Experience the power of conversational statistics analysis with Excelmatic's free plan today.
Try Excelmatic Now and discover why it's becoming the go-to choice for smart, efficient data analysis.


