Working with customer data can be like finding patterns in a haystack. You have hundreds or thousands of users. Some buy often, some spend big, others… well, disappeared months ago. And you're left wondering, who should we focus on? Who's most valuable? Who’s at risk of churn?
That’s where RFM segmentation comes in. It’s a powerful framework that helps you understand customer behavior based on Recency (how recently they purchased), Frequency (how often), and Monetary value (how much they spend). And with the help of Excel AI tools like Excelmatic, you don’t need to build nested formulas or set up complex rules to get answers.
Let's walk through how I used Excelmatic to run RFM segmentation on a real dataset.
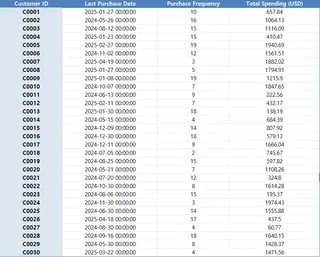
A Quick Look at the Dataset
The dataset had 30 customers, each with their last purchase date, purchase frequency, and total spend.

Step 1 – Calculate the RFM Score
I asked Excelmatic: Please calculate the RFM score for each customer based on recency, frequency, and monetary value.
In a few seconds, I had an RFM score for each customer, where each metric (R, F, M) was scored on a 1–5 scale. The higher the score, the better the customer in that category. Excelmatic even combined the scores into a neat RFM segment field.
What would normally take dozens of formulas, ranking columns, and manual binning—done in one sentence.
Step 2 – Understand Spending by Segment
Next, I asked: Please summarize the average spending per segment group.
The output was clear and meaningful. Excelmatic grouped the customers by RFM segment (like 555, 344, 221) and calculated the average spend for each. Segments like 555 had the highest average spending, while segments with low frequency and monetary value (say, 113 or 122) showed much smaller totals.
This gave me a direct way to prioritize which segments contribute most to revenue—and which ones probably aren’t worth the retention cost.
Step 3 – Target Customers for Reactivation
Finally, I asked: Please suggest customer groups that could be targeted for reactivation.
Excelmatic returned a thoughtful recommendation: customers who haven’t purchased recently (low recency score), but who used to purchase frequently or had higher spending in the past. These are the "sleeping loyalists"—they used to be active but have gone quiet.
I now had a ready-to-use list for a reactivation campaign. No CRM export, no manual filtering, just data to action.
Why This Works So Well in Excel with AI
Normally, to do RFM segmentation, you'd need to convert dates to days, normalize values, rank each customer in three dimensions, and then summarize and interpret the results. It’s effective—but honestly, tedious.
With Excelmatic or similar AI-powered assistants, you just ask questions like you're chatting with an analyst. The hard part? Already done. What you’re left with are insights: who your best customers are, what each segment’s value is, and who’s slipping away.
Final Thoughts
RFM isn’t new, but combining it with Excel AI tools gives it new life. It’s fast, intuitive, and most importantly—actionable. You’re not just looking at numbers, you’re seeing who’s worth keeping close, who might need a nudge, and who you’ve already lost.
So if your customer list feels like just rows and rows of data, try plugging it into an AI tool like Excelmatic. Ask the three questions I used here. And in under 10 minutes, you’ll have a segmentation strategy, a retention plan, and a reactivation list—ready to go.
Click here to see the full prompt flow and try the tool >>
Turn customer chaos into clarity, one prompt at a timeTry Excelmatic now >>


