Creating charts in Excel is an essential data analysis skill, but selecting the right chart type, adjusting the data range, and optimizing the style can be time-consuming. Now, Excelmatic makes all of this much simpler! Just upload your data, and Excelmatic will automatically recommend the best visualization method and generate professional charts with a single click. Today, let's explore how to use Excelmatic to quickly create high-quality charts in Excel.
How Does Excelmatic Help Create Excel Charts?
1. Intelligent Chart Type Recommendations
Different types of data are best represented by different charts:
- Bar Charts are suitable for comparing data across different categories.
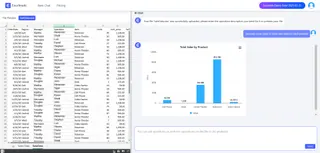
- Line charts are ideal for showing trends over time.
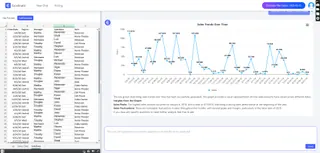
- Pie charts are used to display proportions.
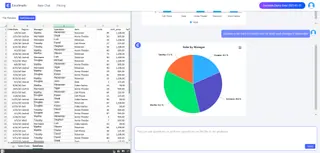
2. One-Click Professional Chart Generation
There's no need to manually insert charts or adjust data ranges. Simply input a command like Generate a sales trend chart or Show product sales proportions, and Excelmatic will quickly create the corresponding Excel chart.
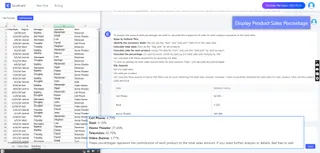
3. Intelligent Data Insights
Excelmatic not only generates charts but also automatically analyzes data trends. These insights can help users make data-driven decisions more quickly.
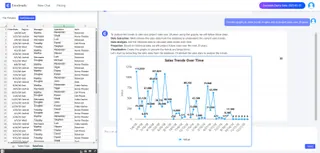
4. Smart Question Suggestions
If you're unsure how to phrase your analysis request, Excelmatic can also suggest appropriate questions.
How does Excelmatic work?
1.Register and Log In
Visit the Excelmatic website and log in to your account.
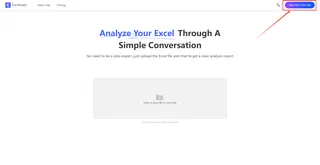
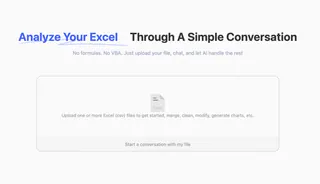
2.Upload Excel Files
Upload your Excel files to Excelmatic. The system supports all common formats, including .xlsx, .xls, and .csv.
3.Ask Questions in Natural Language
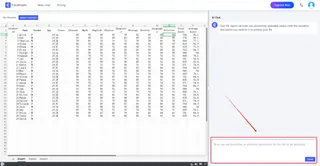
Once your file is uploaded, you can start asking questions in natural language.
For example: Help me count the total sales each month.
4.Get Analysis Reports
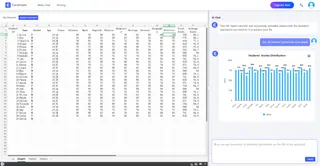
Excelmatic will immediately process your request and generate detailed analysis reports. These reports highlight key metrics and trends, provide data interpretations and recommendations, and support automatic data visualization charts.
Conclusion
Excelmatic has completely transformed the way we visualize data. From data selection to chart generation, and from optimizing aesthetics to trend analysis, Excelmatic makes the entire process simple and efficient. Try Excelmatic Free Now!


