Let’s be honest. KPI tracking in Excel is no one’s idea of a fun day. Between cleaning raw reports, unifying formats, calculating derived metrics like profitability ratios or department performance, and visualizing it all into reports, it can take hours—even days—just to answer one simple question.
And the worst part? If your boss or teammate asks a slightly different question, it means going back into spreadsheet chaos and doing it all over again.
But what if you could skip all of that?
Traditional KPI Analysis in Excel: What It Looks Like
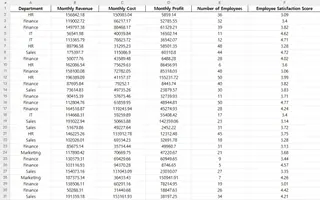
Say you want to evaluate each department's KPI achievement using profitability efficiency—specifically, the ratio of monthly profit to monthly cost. The following is sample data:

You need to:
- Ensure your data is clean (standardize column names, check for missing or outlier values)
- Create a new column with the formula
=Monthly_Profit / Monthly_Cost - Summarize this by department using either a pivot table or summary sheet
- Visually inspect outliers or flag departments that fall below expectations
- Recheck calculations for errors and adjust if fields change
Even for seasoned Excel users, that’s at least 30–45 minutes of careful work for just one metric.
Real-World KPI Examples: From Different Teams
Let’s make it real. These are just a few common KPI metrics across departments:
- Sales: Monthly closed deals ÷ Total leads contacted
- Customer Support: First contact resolution rate
- Product Team: Active users after feature launch ÷ Total users invited
Each one is technically simple—but buried inside messy spreadsheets, they take forever to calculate.
Unless...
Excelmatic: The KPI Shortcut You Needed
Instead of calculating everything manually, you can just ask:
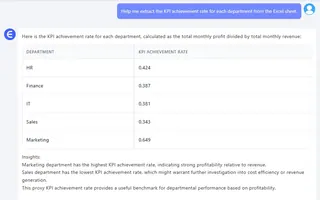
Help me extract the KPI achievement rate for each department from the Excel sheet.
Excelmatic will instantly return a clean summary table, showing each department’s KPI achievement (e.g., Monthly Profit divided by Monthly Cost), and even explain what the metric means.
Here’s a sample insight from the result:
Marketing department has the highest KPI achievement rate, indicating strong profitability relative to revenue.Sales department has the lowest KPI achievement rate, which might warrant further investigation into cost efficiency or revenue generation.This proxy KPI achievement rate provides a useful benchmark for departmental performance based on profitability.

You don’t just get a number—you get understanding.
But Wait—How Does It Work So Smoothly?
Excelmatic doesn’t just read cell A1. It understands context. Even if your sheet says Profit_March and Cost/Dept, it detects patterns, applies the right logic, and calculates accordingly. No renaming needed. No fuss. Just answers.
Behind the scenes, it’s powered by natural language understanding + table structure modeling—so your questions are interpreted just like a human analyst would.
What Else Can You Ask?
Here are a few powerful one-liner prompts that would normally take a whole afternoon to build:
| Question | What You Get |
|---|---|
| “Which department had the highest profit-to-cost ratio last quarter?” | A sorted KPI ranking |
| “Flag departments with KPI below 1.0 in March.” | A list with highlights |
| “Which teams improved the most since January?” | Trend insights + chart |
You’re just asking questions. Excelmatic does the hard part.
Traditional vs. Excelmatic: Let’s Compare
| Task | Traditional Excel | Excelmatic |
|---|---|---|
| Time to calculate ratios | 20–30 min | Instant |
| Filtering, summarizing | Manual steps | Done for you |
| Contextual interpretation | You write it | Auto insights included |
| Response to follow-up Qs | Rebuild formulas | Ask another question |
Real Talk: A User Story
I used to spend Sunday nights building formulas for Monday KPI meetings. Now I just copy my sheet into Excelmatic, ask ‘What’s our KPI trend this quarter?’ and I’m done before Netflix even starts buffering. I’m still shocked it works. — Lisa C., Marketing Analyst
Let the Questions Drive the Data
With Excelmatic, you're not writing formulas—you're just asking the question you really care about. The tool takes care of the math, formatting, and presentation, giving you insights ready to use.
Ready to Stop Wrestling with Your Spreadsheet?
Drop in your KPI data, ask your question, and let Excelmatic handle the rest.
More Excelmatic Magic? Check these out:


