Excel has always been a go-to tool for data analysis, but with AI, it's now a powerhouse for insights and automation. AI not only automates tasks but also makes your spreadsheets smarter and more interactive.
In this blog, we will show you how to analyze Excel data using Excelmatic and provide useful data analysis tables and answers to help you make the most of your data. Let's get started!
5 benefits of using AI to analyze excel data
- improve efficiency and save time
AI can automatically perform tedious data processing tasks, such as data cleaning, formatting and organizing.
- without specialized skills to carry out complex analysis
users do not need to master complex Excel formulas or data analysis skills, you can quickly obtain the required analysis results.
- reduce the error rate and improve accuracy
AI tools can be extremely high precision data processing, as well as automatic verification of data integrity and consistency, to ensure the reliability of the analysis results and reduce errors caused by human negligence.
- Improve data visualization and reporting capabilities
Through AI, the most suitable chart types (e.g:Bar Charts, line charts, pie charts, etc.) can be automatically selected based on data characteristics and analysis needs, and visualization results can be quickly generated.
- Deeper insights and decision support
AI can quickly identify patterns, trends and anomalies in data, even details that human analysts may have overlooked.
Maximize Efficiency by Simplifying Numerous Tasks with Excelmatic
- Conversational AI Simplifies Data Analysis
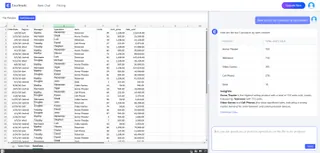
Excelmatic turns data analysis into a conversation. Just describe what you need in plain English, and Excelmatic delivers the answers—no complex formulas or manual work required.
Example: type Show me the top 5 products by salesand you'll get instant results.
- Powerful Data Processing and Analysis Capabilities
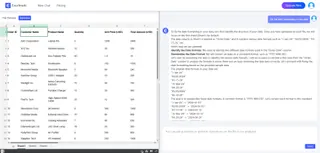
Excelmatic packs a punch with its robust data processing and analysis tools. Whether you're sorting, filtering, or using pivot tables to crunch large datasets, Excelmatic handles it all with ease.
Example: Got a dataset with messy date formats? Just ask Fix the date formatting in my dataand Excelmatic takes care of the rest.
- Intuitive Charts and Visualization
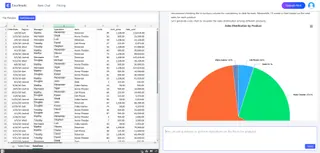
Visu Excelmatic's built-in charting tools automatically generate beautiful, dynamic charts that update in real-time as your data changes. From Bar Charts to line graphs, Excelmatic picks the perfect visual to bring your data to life.
Example: Need to analyze sales share charts for different products? Upload your data and ask Generate Sales Share Chart for each product. Excelmatic will recommend the best chart type that helps you quickly see which products are on the rise and which need a boost.
Start experiencing the convenience of Excelmatic today! It only takes a few simple steps
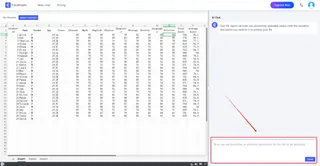
Visit the Excelmatic website.

Sign up for a free account.

Upload your Excel file.

Start your journey to smart data analysis.
Conclusion
Ready to transform your Excel experience? Excelmatic turns data analysis into a breeze. Get instant insights with just a few clicks.
Don't miss out—start your free trial today and unlock the full potential of your data!


