Key Takeaways:
Artificial Intelligence transforms data analysis from a technical specialty into an accessible skill, where asking the right questions becomes more valuable than mastering complex tools.
A successful AI-powered data analysis can accomplish tasks including data preparation, data cleaning, data analysis, data visualization, trend forecasting, and correlation analysis.
Platforms like Excelmatic integrate conversational AI directly into familiar spreadsheet environments, enabling users to generate insights through natural language commands rather than coding.
Traditional data analysis has always required significant expertise in specialized tools, complex formulas, and advanced visualization techniques. However, the emergence of Artificial Intelligence (AI) has fundamentally transformed this landscape. Rather than focusing on technical mastery, AI enables you to become an effective question-asker and decision-maker. Essentially, it serves as your strategic partner, converting your questions into clear, actionable insights.
This is where specialized tools like Excelmatic make a difference. Excelmatic functions as an AI-powered analytics assistant that integrates directly into your spreadsheet environment. Designed to understand natural language commands, it allows you to perform complex data tasks—from cleaning and reporting to visualization and trend forecasting—simply by asking. By embedding AI directly within your data workspace, Excelmatic makes sophisticated analysis accessible to everyone, not just data scientists.
This article will walk you through a complete, AI-driven data analysis workflow. Using a practical scenario—analyzing our "Global E-commerce Sales Dataset (2024) " from a fictional global retailer—we'll demonstrate how Excelmatic transforms raw data into actionable business insights at every stage of the analytical process.

Excelmatic enhances efficiency and depth at every stage
Phase 1: Preparing Your Data — Laying the Foundation
Understanding This Step's Importance
Think of data as the essential raw material for AI. If your input data is disorganized, incomplete, or inconsistent, your output will inevitably be compromised. This initial phase centers on obtaining a clean, well-structured dataset, which serves as the fundamental prerequisite for any accurate and reliable analysis.
Practical Approaches to Sourcing Data
Explore Sample Datasets: For practice purposes, platforms like Kaggle and the UCI Machine Learning Repository offer diverse public datasets perfect for learning.
Leverage AI for Data Generation: You can issue specific instructions to the AI, prompting it to generate a corresponding dataset according to your requirements.
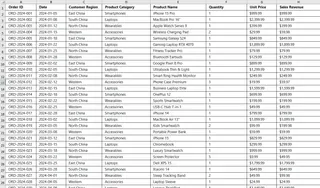
An example instruction for AI would be: "Generate a simulated e-commerce sales dataset with 500 records. Fields should include: Order ID, Date (distributed between January and December 2024), Customer Region (East China, South China, North China, Western), Product Category (Smartphones, Laptops, Wearables, Accessories), Product Name, Quantity, Unit Price, and Sales Revenue. Ensure the data reflects realistic patterns, such as sales peaks during promotional months and a significantly higher average unit price for Laptops compared to Accessories."
The generated Excel dataset is as follows:
- Utilize Your Own Data: This remains the most valuable approach. You can directly upload your actual business files, whether they contain marketing campaign results, sales performance metrics, or user activity logs.
Phase 2: Cleaning and Structuring Data — From Chaos to Order
Understanding This Step's Importance
Raw data typically gets structured for recording purposes rather than analytical efficiency. The primary goal of cleaning and restructuring is to transform your data into a format that AI can deeply comprehend. This process not only resolves immediate data integrity issues but also establishes a robust foundation for advanced analytical techniques like trend identification and correlation discovery.
Relevant AI Instructions
Beyond basic cleaning, you can use advanced instructions to create new analytical dimensions:
Data Enrichment: "Based on the 'Date' column, create three new columns: 'Quarter', 'Month', and 'Day of Week'."
Data Classification: "Next to the 'Sales Revenue' column, create a new 'Order Size Tier' column. Label orders as 'Large' if revenue is >= 2000, 'Medium' for 1000-1999, and 'Small' for < 1000."
Text Processing: "If a 'Customer Review' column exists, create a new 'Sentiment' column and classify the reviews as 'Positive', 'Negative', or 'Neutral'."
Excelmatic in Practice
Continuing with our dataset:
Instruction: "Add 'Quarter' and 'Month' columns. Then, create an 'Order Size' column with the following rule: Sales >= 2000 is 'Major', 1000-1999 is 'Standard', and < 1000 is 'Minor'."

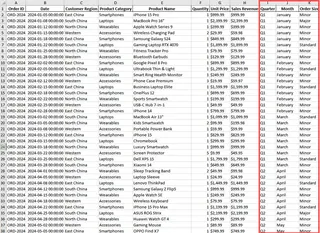
Excelmatic will instantly perform these calculations and populate the new columns, instantly enriching your data view for multidimensional analysis.
Phase 3: Generating Analytical Reports — Gaining Instant Perspective
Understanding This Step's Importance
It's remarkably easy to become lost in data details. A well-constructed analytical report delivers a strategic, high-level overview that enables quick identification of core issues and key opportunities, thereby guiding your subsequent deep-dive investigations.
Relevant AI Instructions
You can request reports with different focuses and for different audiences:
Executive Summary: "Write an executive summary for this 2024 sales data. Summarize annual performance, top and bottom product categories, and provide one key recommendation."
Deep-Dive Analysis: "Analyze Q4 sales performance. Which region showed the fastest growth compared to Q3, and which product category was the primary growth driver?"
Problem Diagnosis: "I have identified an unusual dip in sales for November. Analyze the potential data-driven causes—was it isolated to a specific region or product category?"
Excelmatic in Practice
Instruction: "Generate a 2024 annual sales analysis report. It must include: total annual sales and trend, revenue contribution by product category, top-performing quarter and region, and the single most important business insight derived from the data."
Phase 4: Creating Visualizations — Letting the Data Speak
Understanding This Step's Importance
Visual representations provide the fastest method for the human brain to process complex information. A well-designed chart immediately reveals patterns, trends, and outliers that often remain hidden within raw numbers or text.
Types of Visualizations
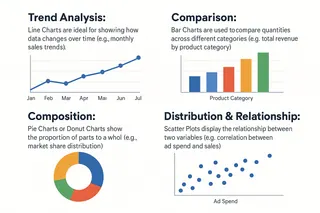
Trend Analysis: Line Charts are ideal for showing how data changes over time (e.g., monthly sales trends).
Comparison: Bar Charts are used to compare quantities across different categories (e.g., total revenue by product category).
Composition: Pie Charts or Donut Charts show the proportion of parts to a whole (e.g., market share distribution).
Distribution & Relationship: Scatter Plots display the relationship between two variables (e.g., correlation between ad spend and sales).
Relevant AI Instructions
Combined View: "Create a dashboard containing: (1) a line chart for monthly sales, (2) a bar chart for annual sales by product category, and (3) a map for sales distribution by region."
Advanced Chart: "Use a stacked bar chart to show the sales composition by product category for each quarter, allowing us to see structural changes."
Excelmatic in Practice
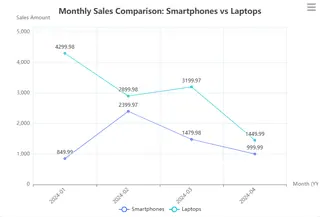
Instruction: "Please create a chart: a dual-line chart where one line shows the monthly sales for 'Smartphones' and the other for 'Laptops', to compare their trends."

Phase 5: Analyzing Trends and Correlations — Forecasting the Future
Understanding This Step's Importance
While describing "what happened" represents looking in the rearview mirror, predicting "what will happen" means steering toward the future. Analyzing trends and correlations aims to uncover hidden drivers and future probabilities within your data, providing forward-looking evidence for strategic planning.
Relevant AI Instructions
Trend Forecasting: "Based on the last 24 months of sales data, forecast the sales for the next 6 months and provide a confidence interval."
Correlation Discovery: "Analyze whether a correlation exists between 'Customer Satisfaction Scores' (if available) and 'Repeat Purchase Rate'."
Root Cause Analysis: "Sales for 'Wearable' devices surged in Q1. Determine which region and which marketing campaign were the primary drivers."
Excelmatic in Practice
Instruction: "Analyze the relationship between the 'Order Size' column (created earlier) and 'Customer Region'. Is there a significant association? For example, is one region more prone to placing 'Major' orders?"
Conclusion: Mastering the Art of Inquiry
This comprehensive workflow demonstrates that the core competency in AI-powered data analysis has shifted from complex coding to the ability to ask high-quality, logical, and progressively deeper questions. The precision and depth of your questions directly determine the value of insights AI can uncover.
Tools like Excelmatic integrate this "conversational analysis" capability directly into your most familiar working environment. This technology elevates your role from technical executor to strategic conductor, empowering your data to deliver clear, actionable intelligence.
Frequently Asked Questions (FAQ)
Q1: I have no background in data analysis or programming. Can I still use AI tools like Excelmatic effectively?
A: Absolutely. These tools are specifically designed for business professionals rather than technical experts. You only need to be able to ask questions about your data in plain English. The AI handles all the complex technical work behind the scenes.
Q2: What's the very first thing I should do when starting with AI data analysis?
A: Start with a clear, specific question you want to answer. Instead of "analyze my sales data," try "which product category showed the strongest growth last quarter and why?" The more focused your question, the better insights you'll get.
Q3: Can AI help me understand why certain trends are happening in my data?
A: Yes, through root cause analysis. You can ask questions like "identify the main factors behind the 30% sales increase in March" or "explain why the Northeast region underperformed compared to other regions."
Q4: What happens if I ask the wrong question or don't get useful results?
A: This is part of the learning process. You can immediately refine your question or ask follow-ups like "can you analyze this from a different perspective?" or "what other factors might be influencing these results?"
Q5: How long does it typically take to get from raw data to actionable insights using AI tools?
A: What used to take days or weeks can now often be accomplished in hours or even minutes. The initial data cleaning might take 30-60 minutes, while generating reports and visualizations typically happens in seconds once your data is prepared.
Try Excelmatic for free now! Now, it's time to open your spreadsheet, or have AI generate a dataset for you, and ask your first question to begin the dialogue.


