Key Takeaways:
- Calculating p-values in Excel traditionally requires understanding complex statistical functions, test types, and significance levels that overwhelm business users
- Excelmatic eliminates statistical complexity by allowing you to find p-values using simple language commands like "is this difference statistically significant?"
- Compared to Excel's T.TEST function and Data Analysis ToolPak, Excelmatic automatically handles test selection, assumptions, and interpretation without technical knowledge
- For professionals running A/B tests, analyzing survey results, or validating business hypotheses, the AI approach delivers accurate statistical significance testing in seconds
Have you ever analyzed experimental data or survey results and wondered if the results you observed are just a coincidence, or if they truly reveal something important? This question lies at the very heart of statistics, and the answer is in a powerful concept called the p-value.
This beginner-friendly guide will equip you with the knowledge to confidently find p-values in Excel. We'll break down what a p-value means and explore different ways to find it, from traditional Excel functions to a revolutionary AI-powered approach. We will cover common methods used in hypothesis testing, such as t-tests and Z-tests, using both built-in functions and the Data Analysis ToolPak. Most importantly, you'll learn how to interpret these p-values to make data-driven decisions with clarity. Ready? Let's dive in!
What is a P-Value?
To understand p-value, we first have to understand statistical significance. Statistical significance is a measure used in data analysis to assess the likelihood that the results observed in a study are caused by a specific factor, rather than by chance. It is closely associated with the p-value, which is a statistical metric that calculates the probability of obtaining results as extreme as those observed, under the assumption that there is no real effect or difference (this assumption is called the null hypothesis).
A p-value acts as a benchmark when checking for statistical significance. If the p-value is small, it suggests that your data is very unlikely under the null hypothesis. In this case, you should consider rejecting the null hypothesis in favor of an alternative that suggests a real effect or difference exists.
How to Find P-Values in Excel: AI vs. Traditional Methods
Excel offers several ways to find p-values, ranging from a modern, conversational AI approach to more traditional, hands-on methods. Let's explore the best option for you.
Method 1: The AI-Powered Way with Excelmatic

For those who want to get straight to the answer without wrestling with formulas or settings, an AI tool like Excelmatic is the fastest and most intuitive solution. Excelmatic acts as your personal data analyst; you simply provide your file and ask a question in plain language.
Let's use the same example of comparing click-through rates (CTR) for two advertising campaigns, A and B.
Steps:
- Upload your Excel file containing the campaign data to Excelmatic.
- In the chat interface, type your request in plain language. For example:
Using the data in this file, compare the click-through rates for Campaign A and Campaign B. Is the difference statistically significant? Calculate the p-value using a two-sample t-test assuming equal variances.
- Press Enter. Excelmatic will instantly perform the analysis and give you the p-value, often with a clear interpretation of the result.
Why this is a better approach:
- No Formulas Needed: You don't need to remember the
T.TESTfunction, its arguments, or its syntax. - No Setup Required: Forget about enabling add-ins like the Data Analysis ToolPak. It just works.
- Intuitive and Fast: Asking a question is far quicker than navigating menus and dialog boxes.
- Built-in Interpretation: Excelmatic doesn't just give you a number; it helps you understand what that number means for your data.
This AI-driven method removes the technical barriers, allowing you to focus on the insights, not the process.
Method 2: Using Excel Functions (The Traditional Way)
If you prefer a more hands-on approach and are comfortable with Excel formulas, using the built-in T.TEST() function is a solid choice. This function compares the means of two datasets and assesses if their difference is statistically significant.
Here’s the formula:
=T.TEST(array1, array2, tails, type)
Where:
array1: The range of data for the first group.array2: The range of data for the second group.tails: Specifies whether you're performing a one-tailed (1) or two-tailed (2) test.type: Denotes the type of t-test (1 for paired, 2 for two-sample assuming equal variances, 3 for two-sample assuming unequal variances).
Let's use our campaign data to see this in action.
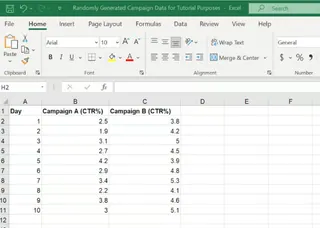
Steps:
- Ensure the CTR values for Campaign A and those for Campaign B are in separate columns.
- Select a blank cell where you want the p-value to be displayed.
- Enter the
T.TEST()formula:=T.TEST(B2:B11, C2:C11, 2, 2) - Press Enter. The cell will display the calculated p-value.

In this example, the p-value is 2.36813E-05 (or 0.0000236813), indicating a very small probability that the observed results happened by chance. We can be confident that our results are statistically significant.
Method 3: Using the Data Analysis ToolPak
The Data Analysis ToolPak is an Excel add-in that provides a guided interface for various statistical functions. If not already enabled, you can activate it by following these steps:
- Go to File > Options > Add-Ins.
- In the Manage dropdown, select Excel Add-ins and click Go.
- Check the box for Analysis ToolPak and click OK.
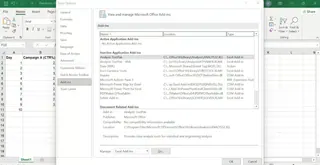
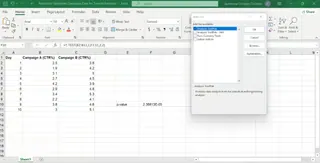
Once enabled, let's use the ToolPak to perform the same t-test on our campaign data.
Steps:
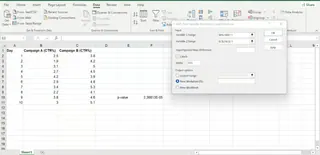
- Go to the Data tab and click Data Analysis in the Analysis group.
- In the pop-up window, select t-Test: Two-Sample Assuming Equal Variances and click OK.
- In the new window, configure the parameters:
- Variable 1 Range: Enter the cell range for Campaign A (
B2:B11). - Variable 2 Range: Enter the cell range for Campaign B (
C2:C11). - Labels: Check this box if your first row contains headers.
- Variable 1 Range: Enter the cell range for Campaign A (
- Click OK.
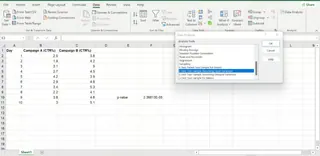
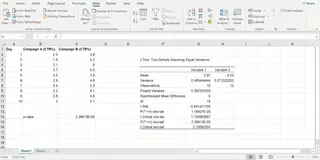
Excel will generate a new sheet or output table with a detailed summary, including the p-value for both one-tailed and two-tailed tests.
Method 4: The Manual Calculation
For those who want to understand the underlying mechanics, you can calculate a p-value manually. Let’s do a Z-test without using the Z.TEST() function. Instead, we will use the STANDARDIZE() and NORMSDIST() functions.
1. Standardize the test statistic
First, use the STANDARDIZE() function to calculate the z-score, which represents how many standard deviations our sample mean deviates from the hypothesized population mean.
=STANDARDIZE(x, mean, standard_dev)
Where:
xis the sample meanmeanis the population meanstandard_devis the population standard deviation
2. Calculate the p-value
Next, use the NORMSDIST() function to find the probability of observing a z-score as extreme as the one you calculated.
=NORMSDIST(z-score)
For a two-tailed test, you would double the result from the NORMSDIST() function, as you’re considering both tails of the distribution. This method is the most complex and is generally used for educational purposes rather than for routine analysis.
How to Interpret P-Values in Excel
To interpret a p-value, you must first establish a significance level (α). This is a threshold that defines how strong your evidence must be to reject the null hypothesis. Commonly, α is set at 0.05 (or 5%).
Interpreting Results:
- p-value ≤ alpha: When the p-value is less than or equal to alpha, you reject the null hypothesis. This suggests a statistically significant difference or effect exists.
- p-value > alpha: When the p-value is greater than alpha, you fail to reject the null hypothesis. There's not enough evidence to conclude a significant difference or effect.
AI tools like Excelmatic often provide this interpretation for you, simplifying the decision-making process.
Important Considerations
Finally, let’s consider some important aspects.
Assumptions
Both t-tests and z-tests assume that your data follows a normal distribution. For t-tests, it’s also assumed that variances are equal if we’re conducting a two-sample test (as we did in our example).
One-tailed vs. Two-tailed Tests
In a one-tailed test, you have a prior expectation about the direction of the difference (e.g., Group A will have higher values than Group B). A two-tailed test is used when you are interested in a difference in either direction. The choice affects how you interpret the p-value.
Limitations of Excel
While Excel offers valuable tools for basic statistical analysis, it has limitations for more complex scenarios. Specialized statistical software might be necessary for advanced calculations. However, modern AI agents like Excelmatic help bridge this gap by handling the complex statistical logic behind the scenes, making advanced analysis more accessible within the Excel ecosystem.
Conclusion
By understanding p-values, you can make more informed, data-driven decisions. We've explored four distinct methods in Excel: the effortless AI approach with Excelmatic, the classic T.TEST function, the guided Data Analysis ToolPak, and the manual calculation.
While learning the traditional methods is valuable for understanding the concepts, modern tools offer a significant leap in efficiency and accessibility. You can choose the method that best fits your comfort level and workflow.
Ready to simplify your statistical analysis? Try Excelmatic today and experience the ease of calculating p-values and testing hypotheses with simple language commands.
Is there a difference between p-value and significance level (alpha)?
Yes, there is a key difference. The p-value is a calculated probability based on your data, while the significance level (alpha) is a predefined threshold you set (usually 0.05) to make a decision. If your calculated p-value is less than your alpha, the result is considered statistically significant.
My data isn't perfectly normal. Can I still use the methods in this article?
The t-test and Z-test assume your data is normally distributed. If your data deviates significantly from a normal distribution, the results might be less reliable. Consider using specialized statistical software or non-parametric tests for a more robust analysis.
When should I use a one-tailed vs. two-tailed test?
Use a one-tailed test if you have a strong prior expectation about the direction of the difference (e.g., you expect Group A to perform better than Group B). A two-tailed test is used when you're interested in any difference, whether higher or lower.
Are there any limitations to using Excel for p-value calculations?
Yes, Excel is great for basic statistical analysis but can be cumbersome for complex models or very large datasets. However, AI add-ins like Excelmatic can help overcome many of these limitations by automating complex tasks and providing expert-level analysis with simple commands.


