As a user growth manager at Excelmatic, I've seen firsthand how mastering Google Sheets functions can transform data analysis from a chore into a superpower. Whether you're tracking user metrics, analyzing campaign performance, or forecasting growth, applying functions across entire columns is a game-changer.
Why Column Functions Matter for Growth Teams
Google Sheets functions are like having a data assistant working 24/7. They automatically calculate, transform, and analyze your user data while you focus on strategy. At Excelmatic, we use these techniques daily to:
- Calculate month-over-month growth rates
- Segment user cohorts automatically
- Clean and prepare raw analytics data
Getting Started With Basic Column Functions
Before we dive into automation, let's cover the fundamentals. These four functions form the backbone of most growth analyses:
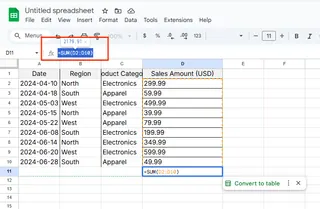
- SUM(range): Perfect for totaling monthly active users

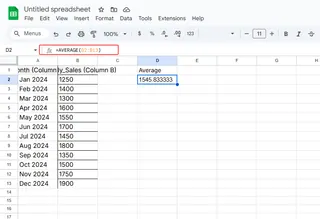
- AVERAGE(range): Great for calculating average session duration

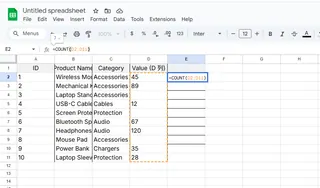
- COUNT(range): Essential for measuring campaign response rates

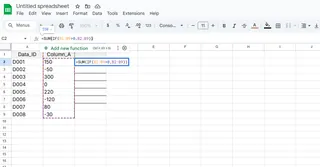
- IF(condition, true, false): The Swiss Army knife for user segmentation

Pro tip: At Excelmatic, we teach our team to always start with =SUM(A:A) for quick column totals - it's faster than selecting ranges manually.
Three Smart Ways to Apply Functions Across Columns
1. The Drag-and-Drop Method (Perfect for Beginners)
- Enter your function in the first cell (e.g., =A2*1.1 for 10% growth)
- Hover over the small blue square in the cell's corner
- Double-click to instantly fill the entire column
This is our go-to method for quick cohort calculations at Excelmatic.
2. ARRAYFORMULA (The Growth Team's Secret Weapon)
For dynamic columns that update automatically, nothing beats ARRAYFORMULA:
=ARRAYFORMULA(IF(A2:A>100, "High Value", "Standard"))
We use this daily to classify users based on engagement thresholds.
3. Conditional Magic with IF/IFS
Growth analysis often requires conditional logic. Here's how we segment users:
=ARRAYFORMULA(IFS(
  A2:A>1000, "Power User",
  A2:A>500, "Active User",
  TRUE, "Casual User"
))
Advanced Automation for Growth Teams
When basic functions aren't enough, we turn to these pro techniques:
Named Ranges: Create reusable references like "Monthly_Users" instead of A2:A100
Error Handling: Wrap formulas with IFERROR to keep dashboards clean
Apps Script: Automate weekly reporting with custom scripts
Why We Built Excelmatic for Growth Analysis
While Google Sheets is powerful, we created Excelmatic to solve the pain points our growth team experienced:
- AI-powered formula suggestions
- Automatic data cleaning
- One-click dashboard generation
- Real-time collaboration features
Instead of spending hours writing ARRAYFORMULAs, our team now describes what they need in plain English, and Excelmatic generates the perfect formula instantly.
Best Practices From Our Growth Playbook
After helping hundreds of teams streamline their data workflows, we recommend:
- Start with a clear analysis goal before writing formulas
- Use comments to document complex functions
- Test new formulas on sample data first
- Organize your sheet with color-coded sections
Take Your Analysis Further
Want to go beyond basic column functions? Excelmatic's AI assistant can:
- Automatically detect trends in your user data
- Suggest optimal growth metrics to track
- Generate ready-to-use formulas for common analyses
The best part? You can try it free today and experience how much faster growth analysis can be when you're not wrestling with spreadsheets.
Remember, whether you're using Google Sheets or Excelmatic, the key to growth is turning raw data into actionable insights. By mastering column functions, you're not just saving time - you're unlocking your team's full analytical potential.


