You’ve created a beautiful line chart showing sales performance over the last six months. The trend is clearly upward. You put it in your slide deck and present it at the quarterly meeting. Your boss nods, impressed, then asks the question that makes you freeze: "Good. So what's the exact month-over-month growth rate? And based on this trend, what's our forecast for next quarter?"
You're stuck. Your chart is a "dumb" visual. It shows what happened, but it can't tell you why or what's next. As part of the Excelmatic team, we believe true analysis doesn't stop at visualization. Our mission is to make AI not just your chart-maker, but your junior data analyst.
With Excelmatic, you will:
- Graduate from "chart-maker" to "analyst" by getting insights directly from your data.
- Speak with numbers, quantifying vague "trends" into concrete "growth rates" and "forecasts."
- Perform professional-grade trend analysis with zero knowledge of statistics required.
What Exactly is "AI Trend Analysis"?
This is more than just generating a line chart. AI trend analysis is a two-step process: first, the AI automatically aggregates your data and creates a visual based on your command (e.g., "Show monthly sales trend"). Then, crucially, it responds to your follow-up questions (e.g., "Analyze this trend") by applying statistical models and giving you key insights in plain English.
In Excelmatic, AI trend analysis can answer:
- Quantified Growth: It calculates the specific growth rate, slope, or compound annual growth rate (CAGR), turning "it looks like it's growing" into "it's growing at an average of 15% per month."
- Trend Interpretation: The AI will tell you if you're looking at "stable linear growth," "exponential takeoff," or "seasonal fluctuations," and help you spot anomalies.
- Simple Forecasting: Based on the established trendline, the AI can provide a statistical projection for future data points, giving you a reference for your decisions.

Real-World Scenarios
See how our users are moving from just "seeing" charts to "understanding" trends.
1. Reporting Quarterly Product Sales to Management
- Where it helps: A product manager needs to report on a new product's sales performance in its first quarter.
- User Testimonial: "I uploaded our weekly sales data and first asked Excelmatic to 'Show weekly sales revenue trend.' Once the chart was up, I followed up with: 'Analyze this trend and tell me the average weekly growth rate.' The AI replied instantly: 'This represents strong linear growth with an average weekly growth rate of approximately 12.5%.' I copied that sentence directly into my report. It was incredibly persuasive." - Sarah, a Product Manager
Why it works: It shortens the analysis chain from "look at chart -> export data -> calculate manually -> form conclusion" to a simple "ask a question -> get a direct conclusion."
2. Assessing the Growth Health of a SaaS Business
- Where it helps: A startup founder needs to monitor the growth velocity of new users.
- User Testimonial: "For us, growth rate is everything. Every month, I feed our user data to Excelmatic and ask, 'Analyze the month-over-month growth trend for new users and forecast the next month.' The trendline and forecast it provides are a critical input for my marketing budget decisions. It's so much faster than wrestling with formulas in Excel." - Michael, a SaaS Founder
Why it works: It provides a forward-looking perspective. It doesn't just summarize the past; it makes a reasonable projection about the future, aiding strategic business decisions.
3. Analyzing Cyclical Fluctuations in Website Traffic
- Where it helps: An e-commerce specialist needs to understand the high and low seasons for site traffic throughout the year.
- User Testimonial: "Our site traffic is highly seasonal. I uploaded the last three years of daily active user data and told Excelmatic: 'Analyze the seasonal trend in this traffic data.' The chart it generated not only showed the overall trendline but also clearly marked the cyclical peaks and troughs, giving me much more confidence in forecasting traffic for our annual sales events." - Jessica, an E-commerce Specialist
Why it works: It can handle more complex analyses, automatically identifying and decomposing cyclical patterns that are difficult to pinpoint precisely by eye, offering a deeper level of insight.
Why Choose Conversational AI Over Manual Analysis
- From Visual to Explainable: The AI doesn't just draw; it explains what the drawing means in plain language.
- Built-in Statistical Models: No need to manually call functions or install add-ins; regression and moving averages are native.
- Quantified Insights: Directly provides key business metrics (KPIs) like growth rates and forecasts.
- Exploratory Analysis: You can have a conversation with your data, asking follow-up questions to drill down deeper.
- Zero Barrier to Entry: Empowers every business user to perform analyses that were once the domain of data specialists.
Analyze Your First Trend with Excelmatic
- Upload Time-Series Data: Upload an Excel or CSV file containing dates and corresponding values.
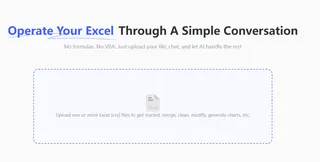
- Generate the Trend Chart: In the chat box, type "Show sales trend by month."

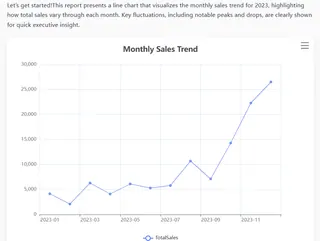
- Ask for Insight: In the same conversation, follow up with "Analyze this trend. What's the growth rate?"
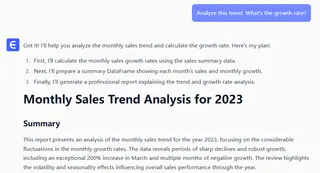
- Get the Analysis: The AI will provide the quantified analysis directly in the chat or as an overlay on the chart.
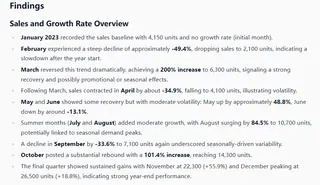
Frequently Asked Questions (F.A.Q.)
Q: How accurate is the AI's analysis? A: The AI uses standard statistical models (like linear regression) to calculate trendlines and growth rates, so the results are mathematically sound. For forecasts, it provides a statistical inference based on the current trend, not a guarantee.
Q: Can it identify complex seasonal trends? A: Yes. For data spanning multiple cycles, you can instruct the AI to "perform a seasonal decomposition." It will attempt to separate the trend, seasonality, and random noise, helping you understand the underlying patterns better.
Q: What else can I ask besides the growth rate? A: You can ask many things, such as "Which period had the fastest growth?", "Add a 30-day moving average," or "How significant is the trend (what's the R-squared value)?"
Final Note
Stop letting your charts remain silent.
The value of data analysis lies in the insight, not the image. It's time to let AI handle that "last mile" from data to decision for you.
Start a free trial of Excelmatic today and listen to the growth story your data is waiting to tell you.


