Survey responses are gold for any business - they tell you exactly what your customers think. But staring at endless rows of raw data? That's overwhelming.
Here's the good news: Excel can transform that messy data into clear insights. Even better? AI-powered tools like Excelmatic can automate most of this work for you. Let's break it down.
Getting Your Survey Data Ready
First things first - clean up your data. It's like tidying your desk before starting work.
- Remove duplicates: Go to Data > Remove Duplicates to clean up repeat responses
- Fix missing values: Blank cells can skew your analysis. Fill them or mark them clearly
- Label everything clearly: Column headers like "Customer Satisfaction (1-5)" make life easier
Pro tip: Excelmatic's AI can automatically clean and organize your survey data in seconds - no manual work needed.
Importing Survey Data Made Simple
Most survey tools export to CSV or Excel formats. Here's how to handle them:
- For CSV files: Just open directly in Excel
- For trickier formats: Use Data > Get External Data options
- Always check: Are special characters displaying correctly? Are columns aligned?
With Excelmatic, you can connect directly to survey platforms like SurveyMonkey or Google Forms - no manual importing needed.
Sorting and Filtering: Your First Insights
Now the fun begins. Want to spot patterns fast?
- Sorting: Click any column header to organize responses (high to low, A-Z, etc.)
- Filtering: Use the dropdown arrows to focus on specific groups (like 18-25 year olds)
These basic tools can reveal surprising trends immediately. But if you want deeper analysis...
Excel Formulas That Do the Heavy Lifting
These formulas will become your best friends:
=AVERAGE(): Find the middle ground in ratings=COUNTIF(): Tally specific responses ("How many said 'Very Satisfied'?")=VLOOKUP(): Connect data across different sheets
Here's the catch: writing formulas takes time and skill. Excelmatic writes all these formulas for you automatically based on your questions.
Visualizing Data That Actually Makes Sense
Charts turn numbers into stories. To create one:
- Select your data
- Go to Insert > Charts

- Choose the right type:
- Pie charts for percentages
- Bar charts for comparisons
- Line charts for trends over time
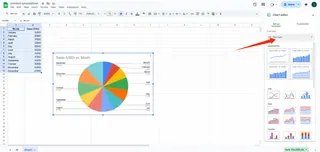
Excelmatic goes further - it suggests the best chart types based on your data and even writes the analysis for you.
Pivot Tables: The Secret Weapon
Pivot Tables summarize complex data instantly. To create one:
- Select your data
- Insert > PivotTable
- Drag fields to Rows, Columns, and Values areas
They're powerful but tricky to master. Or... you could let Excelmatic generate interactive Pivot Tables with one click.
Analyzing Open-Ended Responses
Text responses are tricky but valuable. Try this:
- Create a "Theme" column next to responses
- Tag each response with keywords (e.g., "pricing", "quality")
- Use
=COUNTIF()to tally themes
Excelmatic's AI can actually read and categorize open-ended responses automatically - a huge time saver.
Making Important Data Pop
Conditional formatting highlights what matters:
- Select your data
- Home > Conditional Formatting
- Set rules like "Highlight scores below 3 in red"
This visual cue helps spot issues fast. Excelmatic applies smart formatting automatically based on your data patterns.
Sharing Your Findings
Now that you've uncovered insights:
- Create a dashboard with key charts
- Add clear takeaways in text boxes
- Export to PDF or share via cloud
Or... use Excelmatic to generate a complete report with analysis and recommendations automatically.
The Future of Survey Analysis
While Excel is powerful, AI tools like Excelmatic represent the next evolution:
- Automatic data cleaning and organization
- Instant formula and chart generation
- AI-powered insights and recommendations
- Natural language queries ("Show me satisfaction by age group")
The result? What used to take hours now takes minutes, with deeper insights than manual analysis could provide.
Final Thoughts
Survey analysis doesn't have to be painful. With these Excel techniques, you can transform raw responses into actionable business insights. And with AI-powered tools like Excelmatic, you can get those insights faster and more accurately than ever before.
Want to try the AI-powered approach? Excelmatic offers a free trial that lets you analyze survey data in seconds - no Excel expertise required. Why not see how much time you could save?

