Sales data holds the secrets to your business growth—if you know how to unlock them. But let’s be honest: staring at spreadsheets for hours isn’t exactly thrilling. That’s where AI steps in, turning tedious number-crunching into lightning-fast insights.
At Excelmatic, we’ve seen how AI transforms sales analysis from a chore into a superpower. Here’s how to harness it—no PhD in data science required.
Step 1: Clean Up Your Data (Because Garbage In = Garbage Out)
Before AI works its magic, your spreadsheet needs to be tidy. Think of it like prepping ingredients before cooking:
- Merge your data sources: Combine online sales, in-store purchases, and CRM info into one master sheet.
- Standardize formats: Ensure dates, product names, and prices follow consistent patterns (Pro tip: Excelmatic’s AI can auto-detect and fix inconsistencies).
- Kill duplicates: Use simple filters or let tools like Excelmatic scan for repeats in seconds.
Why Excelmatic Wins at This Stage
While ChatGPT can suggest cleanup steps, Excelmatic actually does the work—automatically flagging errors, filling gaps, and even suggesting optimal data structures.
Step 2: Ask the Right Questions (Your AI Assistant Is Waiting)
With clean data, it’s time to interrogate your numbers. Here’s where AI shines:
- Trend spotting: “Show me sales growth by product category last quarter”
- Customer insights: “Which demographics buy our premium products most?”
- Forecasting: “Predict next month’s revenue based on historical patterns”
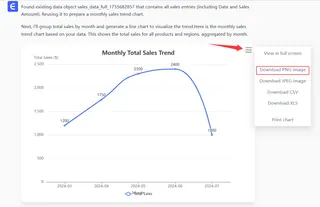
Excelmatic example: Type these questions directly into our AI sidebar, and watch as it generates answers with interactive charts—no formula writing needed.
Step 3: Visualize Like a Data Storyteller
Humans process visuals 60,000x faster than text. AI helps create:
- Dynamic dashboards: Live-updating bar charts comparing regional performance
- Seasonality graphs: Spot annual trends with color-coded line charts
- Pie charts: Reveal which products dominate your revenue pie
Why settle for static charts? Excelmatic’s AI suggests the best visualization for your data type and even animates trends over time.

Pro-Level Moves: Pivot Tables & Formulas Made Easy
Scared of pivot tables? AI demystifies them:
- Ask: “Create a pivot table showing monthly sales by product line”
- Watch as Excelmatic builds it—with drag-and-drop customization
- Drill deeper: “Now filter to show only top-performing regions”
For formulas, try: “Calculate customer lifetime value using purchase frequency and average order value” → Get the perfect equation instantly.
From Insights to Action
AI’s real value? Turning analysis into strategy:
- Flag risks: “Why did Midwest sales drop 15% last month?” AI cross-references weather data, finding a correlation with storms delaying shipments.
- Boost wins: “Which email campaign drove the most high-value customers?” Replicate that messaging ASAP.
The Future Is Automated
Imagine:
- Auto-generated reports hitting your inbox every Monday
- AI alerts when sales deviate from expected patterns
- Team dashboards that update in real-time
With Excelmatic, this isn’t futuristic—it’s today’s reality.
Try This Now
- Upload your sales data to Excelmatic
- Ask: “What’s our most profitable product, and who buys it?”
- Watch as AI delivers insights + ready-to-present visuals in <60 seconds
No more spreadsheet headaches. Just smarter decisions, faster.
Ready to transform your sales analysis? Get started with Excelmatic’s free AI tools today.


