We've all been there - staring at a spreadsheet full of sales numbers, wondering what story they're trying to tell. As a growth manager, I used to spend hours manually crunching data until I discovered the magic combo: Google Sheets + AI tools like Excelmatic. Let me show you how to turn that data overwhelm into clear insights.
Why AI-Powered Sales Analysis Matters
Gone are the days of manual number crunching. Modern businesses need real-time insights to stay competitive. That's where AI steps in - it can spot patterns humans might miss and do in minutes what used to take days.
Excelmatic leads the pack here, offering built-in AI that understands your sales data context. While other tools require complex setups, Excelmatic works right inside your familiar spreadsheet environment.
Setting Up Your Sales Data
First things first - get your data into Google Sheets. You can:
- Manually enter recent sales
- Import from CSV/Excel (File > Import)
- Connect directly to your CRM (more on this later)
Pro tip: Use Excelmatic's data cleaning features to automatically:
- Remove duplicates
- Fill missing values
- Standardize formats
Basic Analysis Made Simple
Start with these essential Google Sheets functions:
- SUM:
=SUM(E2:E100)- Total revenue - AVERAGE:
=AVERAGE(F2:F100)- Average order value - COUNTIF:
=COUNTIF(C2:C100,"Product A")- Sales by product
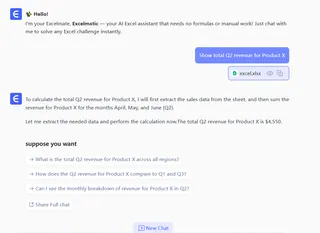
But here's where it gets exciting - Excelmatic can generate these formulas for you. Just describe what you need in plain English: "Show total Q2 revenue for Product X."

Visualizing Your Data
Numbers tell the story, but charts make it stick. With Excelmatic:
- Upload your files
- Ask: "Create a monthly sales trend chart"
- Watch as it generates the perfect visualization
Common chart types:
- Line charts for trends over time
- Bar charts for product comparisons
- Pie charts for market share
Advanced AI Analysis
This is where traditional spreadsheets fall short and AI shines. With Excelmatic, you can:
Predict future sales
Ask: "Forecast next quarter's revenue based on past trends" and get an instant projection with confidence intervals.
Identify hidden patterns
"Show products frequently bought together" reveals cross-selling opportunities you might have missed.
Automate reporting
Set up dashboards that update in real-time, so you always have the latest insights at your fingertips.
Pro Tips for Better Analysis
- Clean data first - Garbage in, garbage out applies doubly to AI analysis
- Ask specific questions - "Why did Midwest sales drop in March?" works better than vague requests
- Combine human + AI - Use AI for number crunching, apply your business knowledge to interpret results
Beyond Basic Sheets: When to Upgrade
While Google Sheets is great for starters, growing businesses often need more robust solutions. Excelmatic offers:
- Automated data syncs from your CRM/eCommerce platform
- Collaborative dashboards your whole team can access
- Advanced modeling like customer lifetime value predictions
The Future of Sales Analysis
The days of manual spreadsheet work are ending. AI-powered tools like Excelmatic are making sophisticated analysis accessible to everyone - no data science degree required.
Want to try it yourself? Excelmatic offers a free trial where you can upload your own sales data and see the AI in action. It's literally like having a data analyst on your team, without the six-figure salary.
Remember: The goal isn't just prettier spreadsheets - it's making faster, smarter business decisions. And that's something worth analyzing.


