Sales data analysis doesn't have to feel like deciphering ancient hieroglyphics. With Excel (and a little help from AI tools like Excelmatic), you can turn those confusing spreadsheets into clear insights that actually help your business grow.
Think of it like this: your sales data is a treasure chest. Excel gives you the tools to crack it open—you just need to know which keys to turn.
Here's the no-BS guide to analyzing sales data in Excel, whether you're tracking monthly performance or predicting next quarter's revenue.
Step 1: Clean Your Data First (Trust Us, It Matters)
Before you dive into analysis, you need to prep your data. It's like washing vegetables before cooking—skip this step and you'll regret it later.
Pro tips:
- Kill duplicates: Go to Data > Remove Duplicates. Excelmatic can actually do this automatically with its data cleaning features (more on that later).
- Fix formatting: Make sure all dates look the same and numbers don't have random dollar signs stuck to them.
- Fill in blanks: Decide whether to replace missing data with zeros, averages, or another value.
Excelmatic users: Our AI can scan your dataset and suggest cleaning actions in about 2 seconds. Just sayin'.
Step 2: Sort and Filter Like You Mean It
These basic tools are more powerful than most people realize:
- Sorting: Click any column header and sort A→Z or Z→A. Instant way to spot your best/worst performers.
- Filtering: Click the funnel icon to only see specific products, regions, or time periods.
Cool trick: Combine filters with conditional formatting (more on that below) to make important data pop visually.
Step 3: Master These 3 Essential Formulas
Don't freak out—these formulas are simpler than they look:
- =SUM(): Adds up all sales in a range
- =AVERAGE(): Finds the typical sale amount
- =COUNT(): Tells you how many transactions occurred
Excelmatic shortcut: Describe what you want in plain English ("show me total Q2 sales") and our AI writes the formulas for you.
Step 4: Make Data Visual (Because Nobody Likes Staring at Numbers)
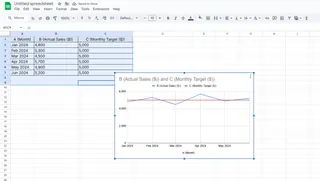
Charts transform boring numbers into stories:
- Bar charts: Compare products or sales reps
- Line graphs: Show trends over time
- Pie charts: Display market share (use sparingly)
Pro move: Excelmatic can automatically suggest the best chart type for your specific data.
Step 5: Unleash Pivot Tables (Your Secret Weapon)
Pivot tables sound scary but they're just organized data summaries:
- Select your data
- Go to Insert > PivotTable
- Drag fields to Rows/Columns/Values areas
Example: Drag "Product" to Rows and "Revenue" to Values to instantly see which items sell best.
Game changer: Excelmatic's AI can build pivot tables based on your questions ("show sales by region and product category").
Step 6: Highlight What Matters with Conditional Formatting
Make important data jump off the screen:
- Color-code high/low values
- Add data bars that grow with the numbers
- Set up alerts for specific thresholds
Step 7: Predict the Future (Sort Of)
Excel's trendlines help forecast sales:
- Create a line chart
- Right-click the data series
- Add Trendline > Choose type (linear usually works)

Next-level: Excelmatic's predictive analytics can factor in seasonality and market trends automatically.
Bonus: Automate the Boring Stuff
If you're doing the same tasks repeatedly:
- Record a macro (View > Macros > Record Macro)
- Perform your actions
- Stop recording
Now you can replay those steps with one click. Excelmatic takes this further with AI-powered automation that learns your workflows.
Why Stop at Basic Excel?
While Excel is powerful, tools like Excelmatic supercharge your analysis:
- AI does the heavy lifting: Describe what you need in plain English
- Instant dashboards: No more manual chart building
- Smart predictions: Get forecasts without complex formulas
- Collaboration made easy: Share live reports with your team
The bottom line? You can spend hours wrestling with Excel, or you can work smarter with AI assistance. Either way, now you've got the skills to turn sales data into real business insights.
Ready to upgrade your Excel game? Try Excelmatic free and see how much time you can save.


