Marketing data used to feel like a tangled mess—until AI came along. Now, tools like Excelmatic (our AI-powered spreadsheet assistant) turn chaos into clear insights faster than you can say "ROI."
Here’s how to combine Excel’s number-crunching power with AI’s brainpower to level up your marketing game.
Step 1: Know Your Data’s DNA
Before diving into analysis, map out your data sources:
- Demographics: Age, location, gender (who’s buying?)
- Behavior: Clicks, shares, cart abandons (what are they doing?)
- Transactions: Sales, refunds (what’s driving revenue?)
- Engagement: Watch time, scroll depth (what content sticks?)
Pro tip: Use Excelmatic’s auto-categorization to tag messy data instantly—no manual sorting needed.
Step 2: Set Up Your Excel Battle Station
A clean spreadsheet = happy analysis. Structure columns like this:
| Date | Source (e.g., Instagram) | Metric (e.g., CTR) | Value |
|---|
Too busy to format? Excelmatic’s smart templates auto-build marketing dashboards in 2 clicks.
Step 3: Unleash Excel’s Secret Formulas
Stop calculating manually. These formulas do the heavy lifting:
- SUMIFS(): "Show me total sales from Q1 to Q2"
- AVERAGE(): "What is our monthly average sales volume?"
- XLOOKUP(): "Pull last month’s conversion data for this SKU"

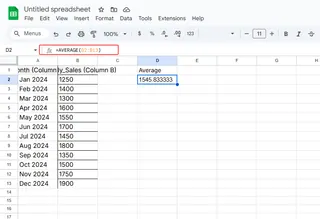
Don’t memorize them—Excelmatic suggests formulas as you type, like Grammarly for spreadsheets.
Step 4: Visualize Like a Data Artist
Numbers lie flat. Charts tell stories. Right-click your data and try:
📈 Line charts for trends (e.g., weekly signups)
📊 Stacked bars for comparisons (Facebook vs. Google Ads)
🍰 Donut charts for budget breakdowns
Step 5: Add AI Superpowers
Here’s where it gets wild. With Excelmatic’s AI Analyst, you can:
Ask questions naturally:
- "Why did Q2 conversions drop?"
- "Predict holiday sales based on last year’s data"
Get instant insights:
- "Your TikTok ads underperform for ages 35+. Try shifting 20% budget to Reels."
Automate reports:
- "Generate a weekly performance PDF for the CEO"
No more staring at pivot tables until 3 AM.
Real-World Example: The 10-Minute Campaign Audit
Imagine analyzing a holiday campaign across 5 channels. Here’s the AI-assisted workflow:
- Dump raw data into Excelmatic
- Ask: "Which channel had the highest ROI?"
- Visualize: Auto-generated bar chart shows Instagram winning
- Diagnose: AI flags "Email subject lines under 50 chars performed 2X better"
- Act: Reshuffle budgets before Black Friday
Traditional time: 4 hours. With AI: under 10 minutes.
Pitfalls to Avoid
🚫 Garbage in = garbage out: Clean data first (use Excelmatic’s Remove Duplicates and Fill Blanks tools)
🚫 Analysis paralysis: Set a 15-minute timer for decision-making
🚫 Siloed data: Connect Excelmatic to your CRM/ads platforms for live updates
Why Stop at Excel + ChatGPT?
While pairing Excel with generic AI helps, Excelmatic is built specifically for marketing data:
✔ No prompt engineering—ask in plain English
✔ One-click integrations with Google Analytics, Meta Ads, etc.
✔ Team collaboration with shared dashboards
Think of it as ChatGPT with a marketing degree and Excel on steroids.
Your Turn
Next time you’re drowning in spreadsheets:
- Upload data to Excelmatic
- Ask what you need (e.g., "Find top 3 leaky funnel stages")
- Implement the AI’s recommendations
Data-driven decisions shouldn’t require a data science team. With the right tools, they’re just a few clicks away.
P.S. Hit reply if you want our free "5-Minute Marketing Audit" Excelmatic template—pre-loaded with AI analysis shortcuts.

