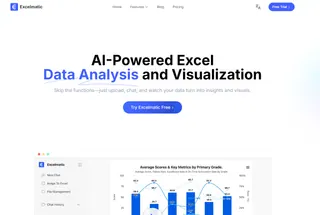
Let’s face it—manually analyzing data in Excel can feel like searching for a needle in a haystack. But what if your spreadsheet could think for you? AI has turned Excel from a simple number-crunching tool into a smart data analyst that spots trends, predicts outcomes, and even answers your questions in plain English.
While Excel’s built-in AI features are handy, tools like Excelmatic take this to the next level by making AI-driven analysis as easy as typing a sentence. Here’s how to harness both for next-level insights.

Why AI + Excel = A Match Made in Data Heaven
Gone are the days of writing complex formulas for hours. AI in Excel (and supercharged by Excelmatic) helps you:
- Spot trends instantly, like sudden sales drops or seasonal spikes.
- Predict future numbers using historical data—no stats degree needed.
- Ask questions like “What were Q3’s top-selling products?” and get charts as answers.
Excel’s Built-in AI Tools (And Their Limits)
Excel offers basic AI features, but they often require perfect data setup and lack customization. Here’s what’s included:
- Analyze Data: Auto-generates charts and highlights trends.
- Downside: Only works with flawlessly formatted tables.
- Ideas: Suggests generic visualizations (e.g., “Sales by Region”).
- Downside: Rarely digs deep enough for actionable insights.
- Forecasting: Predicts future values if you have clean historical data.
- Downside: Struggles with irregular patterns or small datasets.
These tools are helpful starters, but for real power, you need Excelmatic.
Why Excelmatic Outshines Native Excel AI
Excelmatic isn’t just another add-on—it’s like giving Excel a brain transplant. Here’s how it solves Excel’s AI shortcomings:
1. No More Data Wrestling
- Problem: Excel’s AI fails if your data has blanks or messy headers.
- Excelmatic Fix: Automatically cleans and structures data for you. Just paste your dataset and go.
2. Smarter, Faster Insights
- Problem: “Ideas” offers basic charts but misses nuanced patterns.
- Excelmatic Fix: Asks follow-up questions to drill deeper (e.g., “Show top products with profit margins”).
3. Plain English = Instant Answers
- Problem: Excel’s natural language queries often misinterpret complex questions.
- Excelmatic Fix: Understands queries like, “Which clients are at risk of churning?” and builds churn prediction models on the fly.
4. One-Click Forecasting That Actually Works
- Problem: Excel’s forecasts assume perfect historical trends.
- Excelmatic Fix: Adjusts for real-world variables (e.g., promotions, holidays) for accurate predictions.
How to Use AI in Excel (The Right Way)
Step 1: Prep Your Data
- For Excel’s AI: Format as a table with headers (Ctrl+T). Remove blanks.
- For Excelmatic: Just upload—it handles the rest.
Step 2: Choose Your AI Tool
- Quick Insights: Use Excel’s “Analyze Data” for surface-level trends.
- Deep Analysis: Switch to Excelmatic and type, e.g., “Find anomalies in last month’s sales.”
Step 3: Refine and Act
- Critical Tip: AI spots patterns, you interpret them.
- Example: If AI flags a sales dip, check for supply chain issues or competitors.
Pro Tip: When to Use Excelmatic vs. Native AI
| Scenario | Excel’s AI | Excelmatic |
|---|---|---|
| Quick chart from clean data | ✅ | ✅ |
| Forecasting with outliers | ❌ | ✅ |
| Natural language queries | ⚠️ (Basic) | ✅ (Advanced) |
| Auto-data cleaning | ❌ | ✅ |
The Bottom Line
Excel’s AI tools are a great start, but Excelmatic is the secret weapon for professionals who need:
- Speed: Insights in seconds, not hours.
- Depth: From “what happened” to “what will happen and why.”
- Simplicity: No coding, no data prep—just ask and analyze.
Ready to stop drowning in spreadsheets? Try Excelmatic free today and let AI do the heavy lifting.
About the author: As a growth lead at Excelmatic, I’ve seen teams cut analysis time by 80% using AI. My mission? Help you work smarter, not harder—because even data deserves a little magic. ✨


