Let’s be real—data isn’t always black and white. Whether you’re forecasting sales, analyzing lab results, or tracking project budgets, uncertainty is part of the game. Ignoring it? That’s like predicting the weather without checking the radar.
Luckily, Excel gives you the tools to handle uncertainty like a boss. And if you want to take it to the next level, Excelmatic (our AI-powered spreadsheet assistant) can automate the heavy lifting. But first, let’s break down the basics.
Why You Should Care About Uncertainty
Think of uncertainty as your data’s "margin of error." It tells you how much wiggle room your numbers have. Here’s why it matters:
- Better forecasts: Sales projections with uncertainty ranges prepare you for best- and worst-case scenarios.
- Smarter decisions: Knowing the possible error in your data keeps you from overcommitting.
- More credibility: Transparent uncertainty ranges make your reports look pro (no more "trust me bro" charts).
Step 1: Calculate Uncertainty with Standard Deviation
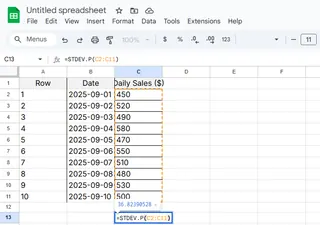
The easiest way to quantify uncertainty? Standard deviation. It measures how spread out your data is.
How to Do It in Excel:
- Dump your data into a column (e.g., A1:A10).
- In an empty cell, type:
=STDEV.P(A1:A10)for the full dataset.=STDEV.S(A1:A10)for a sample.
- Hit Enter. Boom—you’ve got your uncertainty metric.

Pro Tip: Excelmatic can auto-calculate this (and explain the results) if you describe your data.
Step 2: Visualize Uncertainty with Error Bars
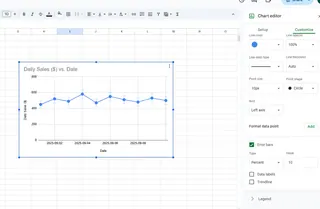
Numbers are cool, but visuals win meetings. Add error bars to your charts to show uncertainty ranges:
- Create a chart (e.g., a bar or line graph).
- Click the chart > Chart Design > Add Chart Element > Error Bars.
- Customize:
- Fixed value: Manually set the range (e.g., ±5%).
- Standard deviation: Use your earlier calculation.

No time to fiddle? Excelmatic generates charts with error bars automatically—just ask.
Step 3: Propagate Uncertainty in Formulas
Got calculations that depend on uncertain inputs? Here’s how to carry that uncertainty through:
Example: Calculating the area of a rectangle (Length × Width) with uncertain measurements.
- Enter Length (B2), Width (C2), and their uncertainties (B3, C3).
- Calculate Area:
=B2*C2. - Calculate Area’s uncertainty:
=D2*SQRT((B3/B2)^2 + (C3/C2)^2)
Translation: The more uncertain your inputs, the more uncertain the result.
Level Up: Advanced Techniques
Scenario Analysis
Use Excel’s Scenario Manager (Data > What-If Analysis) to test how different uncertainties affect outcomes.
Monte Carlo Simulations
Simulate 1,000+ possible outcomes using random inputs (=RAND()). Excelmatic can automate this—no PhD required.
Pitfalls to Avoid
- Overconfidence: A precise number ≠ an accurate one. Always show the range.
- Ignoring correlations: If two inputs are linked (e.g., price and demand), use covariance.
- One-trick ponies: Combine methods (error bars + scenarios) for the full picture.
Why This Matters
Adding uncertainty isn’t about complicating your data—it’s about embracing reality. With Excel (and a boost from Excelmatic), you’ll:
✅ Build bulletproof forecasts.
✅ Spot risks before they bite you.
✅ Look like the data wizard you are.
Try Excelmatic Free: Ditch manual uncertainty math. Let AI do it for you.
About the Author:
Hi! I’m [Your Name], a data nerd at Excelmatic. I help teams turn messy spreadsheets into decision-making supertools. When I’m not geeking out over error bars, I’m probably hiking or bribing my cat with treats.*


