Ever stared at a spreadsheet wondering which numbers actually matter? Highlighting cells is like putting neon signs on your most important data. But here's the secret: most people only use 10% of Excel's highlighting magic.
As a growth manager who lives in spreadsheets, I'll show you pro techniques that save hours - plus how tools like Excelmatic can automate the whole process with AI.
The Basic Highlight You Already Know (But Aren't Using Enough)
- Manual Color Fill - The OG method:
- Select cells → Home tab → Paint bucket icon → Choose color
- Pro tip: Create a color code system (red for urgent, green for good)
But let's be real - this gets old fast when you're working with 500+ rows. That's where the smart stuff comes in.
Conditional Formatting: Your Spreadsheet's Auto-Pilot
This is where Excel starts feeling like magic. Set rules like:
- "Highlight sales over $10K in gold"
- "Flag overdue dates in red"
How to set it up:
- Select your data range
- Home tab → Conditional Formatting
- Choose rules like:
- Greater than/Less than
- Top 10%
- Duplicate values
The best part? It updates automatically as data changes. No more manual recoloring every Monday.
Next-Level Visuals: Data Bars & Color Scales
Want to see trends at a glance? Try these:
- Data Bars: Fills cells with length-based gradients
- Color Scales: Heatmaps from red (low) to green (high)
Perfect for:
✅ Sales performance tracking
✅ Inventory level monitoring
✅ Survey response analysis
The Hidden Gem: Formula-Based Highlighting
For custom rules like:
"Highlight weekends AND high-priority tasks"
Use the "New Rule" → "Use formula" option with logic like:=AND(WEEKDAY(A1)>5,B1="High")
When to Bring in AI (Like Excelmatic)
Here's the truth: Even conditional formatting takes setup time. That's why our team uses Excelmatic to:
- Auto-detect patterns worth highlighting
- Apply smart formatting based on data types
- Update visuals in real-time

For example, it can:
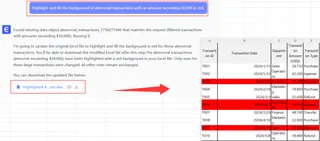
🔹 Spot and highlight statistical outliers
🔹 Color-code changing trends automatically
🔹 Maintain consistency across reports
Pro Mistakes to Avoid
- Rainbow spreadsheet syndrome: Too many colors = visual noise
- Forgotten rules: Audit conditional formats monthly
- Static ranges: Expand ranges when adding new data
Real-World Use Cases
- Finance: Flag unusual transactions
- HR: Highlight employees nearing PTO limits
- Marketing: Color-code high-performing campaigns

The Bottom Line
While Excel's built-in tools are powerful, AI solutions like Excelmatic take highlighting to the next level by:
- Reducing manual work
- Discovering insights you might miss
- Keeping visuals always up-to-date
Want to try AI-powered highlighting? Excelmatic's free tier lets you test it with your own data.
About the author: As Excelmatic's Growth Manager, I've helped 500+ teams work smarter with spreadsheets. My mission? Replace boring data chores with AI magic.


