Google Sheets is awesome for turning boring spreadsheets into eye-catching charts. But if your X-axis looks messy or missing, your data story falls flat. Let’s fix that.
Why Your X-Axis Matters More Than You Think
The X-axis is like the foundation of your chart – it gives meaning to all those bars and lines. Whether you're tracking:
- Monthly sales
- Survey results
- Project timelines
A clear X-axis helps your audience "get it" at a glance.
Building Your First Chart (It’s Easier Than You Think)
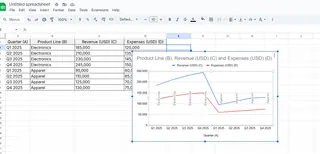
- Enter your data – Keep it simple (e.g., months in Column A, sales in Column B)
- Highlight the cells – Click and drag over your data range
- Insert > Chart – Google Sheets will suggest a chart type
- Pick your style – Column, line, or bar charts work best for most X-axis data
Pro tip: Excelmatic can automate this entire process with AI – just upload your data and describe what you need.
Customizing Your X-Axis Like a Data Wizard
Found your chart looking wonky? Here’s how to fix it:
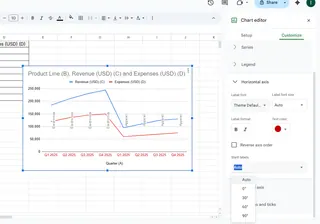
- Click your chart to open the Chart Editor
- Switch to the "Customize" tab
- Select "Horizontal axis"
- Play with these settings:
- Label font/size – Make text readable
- Label rotation – Fix crowded labels
- Scale type – Switch between linear/log scales
Fun fact: Excelmatic automatically optimizes these settings based on your data type – no manual tweaking needed.
Common X-Axis Problems (And Quick Fixes)
🔴 Missing labels?
→ Check your data includes headers
🔴 Labels overlapping?
→ Rotate text 45° in the Customize tab
🔴 Dates out of order?
→ Sort your source data first
When Manual Spreadsheets Aren’t Enough
While Google Sheets gets the job done, tools like Excelmatic take it further by:
✅ Auto-detecting the best X-axis format
✅ Generating interactive dashboards from raw data
✅ Updating charts in real-time as data changes
Next time you need to:
- Present to executives
- Share reports with clients
- Analyze trends over time
Consider upgrading from manual charts to AI-powered visualization.
Your Turn to Shine
Now you’ve got the skills to:
✔ Create basic charts
✔ Fix X-axis issues
✔ Make data visually compelling
Remember: Great charts tell stories. Your X-axis sets the stage – make it count.
P.S. If you create charts regularly, test drive Excelmatic’s AI chart builder. It turns 30 minutes of manual work into 30 seconds of magic. 🚀


