Let's be real—manually adding trendlines in Excel feels like solving a puzzle blindfolded. You're never quite sure if you picked the right trendline type, and tweaking settings eats up precious time. What if your spreadsheet could think for itself? That's where AI comes in.
Why Trendlines Matter (And Why AI Makes Them Better)
Trendlines are like GPS for your data—they show where your numbers are heading. Sales teams use them to spot growth patterns, finance teams forecast budgets, and marketers track campaign performance. But traditional Excel trendlines have three big problems:
- They assume linear relationships (real-world data rarely plays that nice)
- Choosing between exponential, polynomial, or moving average is pure guesswork
- Large datasets turn trendline adjustments into a time sink
Enter Excelmatic—our AI-powered solution that analyzes your data and suggests the perfect trendline automatically. No statistics degree required.
The Old-School Way (And Why It Frustrates Everyone)
Here's the manual process we're all familiar with:
- Select your data (monthly sales, website traffic, etc.)
- Insert a basic chart (usually line or scatter)
- Click "Add Trendline" and pray you chose the right type
- Manually adjust until it looks right

This works for simple datasets, but when your numbers have seasonal spikes, irregular patterns, or complex relationships? Good luck.
How AI Changes the Game
Excelmatic's AI engine does the heavy lifting by:
✅ Scanning your data for hidden patterns
✅ Testing multiple trendline models in seconds
✅ Recommending the best fit with accuracy scores
✅ Even explaining why it chose that trendline
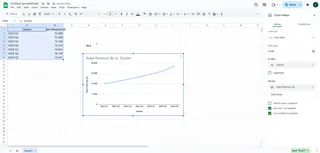
Example: Excelmatic analyzing 18 months of sales data and recommending a polynomial trendline with 94% accuracy
Step-by-Step: Adding AI Trendlines with Excelmatic
Upload your data
Drag your Excel file into Excelmatic or connect directly to your spreadsheetAsk the AI
Type "Show me the best trendline for this sales data" or let the AI auto-detect your needsReview smart suggestions
Excelmatic displays ranked options with confidence scores and visual previewsOne-click apply
Choose your preferred trendline and it's instantly added to your chartGet bonus insights (Our favorite part)
The AI explains key findings like:- "This 3-month dip is normal seasonal variation"
- "Expect 12% growth next quarter based on this pattern"
Real-World Example: E-commerce Traffic Analysis
Imagine you're analyzing website visits. The manual approach might show a basic upward line, missing crucial details. With Excelmatic:
- The AI spots weekly spikes (higher traffic on weekends)
- Recommends a moving average trendline to smooth out noise
- Flags an unusual mid-month drop (turns out it was a server outage)
- Projects next month's traffic with 89% confidence
This took 37 seconds. Manually? You'd still be adjusting axis scales.
Pro Tips for AI-Powered Trendlines
Clean data = better insights
Remove obvious outliers before analysis (Excelmatic can help identify these too)Ask "why"
Click any trendline to see the AI's reasoning: "This exponential fit works best because growth accelerates after marketing spend exceeds $20k"Compare scenarios
Test how different trendlines affect projections—great for budget planningSet alerts
Configure Excelmatic to notify you when actual data deviates significantly from predictions
Beyond Basic Trendlines: What Else AI Can Do
Excelmatic doesn't stop at trendlines. Our AI can:
🔮 Forecast future values with confidence intervals
📊 Suggest complementary charts (like adding a seasonality breakdown)
⚠️ Highlight data anomalies you might have missed
🔄 Automatically update analyses when new data arrives
The Bottom Line
Adding trendlines shouldn't feel like a statistics exam. With AI tools like Excelmatic, you get:
- Accuracy: No more guessing between linear vs. logarithmic
- Speed: Analysis that used to take hours happens during your coffee break
- Clarity: Plain-English explanations instead of confusing R-squared values
Ready to work smarter? Try Excelmatic free for 14 days—your spreadsheets will thank you.
About the author: As Excelmatic's Growth Lead, I've seen thousands of users transition from frustrated trendline tweakers to data analysis rockstars. My mission? Make advanced analytics accessible to everyone—no PhD required.


