Let's be real - when you hear "slope calculation," you probably flash back to high school algebra. But what if I told you this simple math concept could help you predict sales trends, optimize marketing spend, and make smarter business decisions?
At Excelmatic, we've seen how slope analysis helps businesses:
- Spot rising customer acquisition costs before they hurt profits
- Identify which marketing channels deliver the best ROI
- Forecast inventory needs based on sales velocity
Slope 101: The Business Superpower You Didn't Know You Needed
Slope measures how fast something is changing. In business terms:
- A steep positive slope = rapid growth (cha-ching!)
- A gentle slope = steady progress
- Negative slope = warning signs ahead
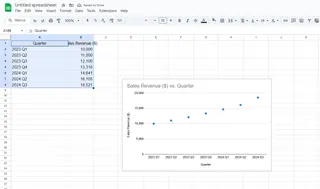
Imagine tracking your monthly revenue. The slope tells you whether you're accelerating (getting steeper) or plateauing (flattening out). This is gold for making data-driven decisions.
The Manual Method: Calculating Slope in Google Sheets
Here's how to do it the old-school way:
Organize your data
Column A: Time periods (months, quarters)
Column B: Your metric (sales, signups, etc.)Use the SLOPE function
=SLOPE(B2:B10, A2:A10)
(Where B is your metric and A is your time periods)Interpret the results
- Positive number = upward trend
- Negative number = downward trend
- Larger number = faster change
Pro tip: Add a scatter plot with a trendline to visualize your slope. Just select your data > Insert > Chart > Scatter.

Why Stop at Slope? Excelmatic Does the Heavy Lifting
While Google Sheets gets the job done, Excelmatic transforms slope analysis from a math exercise into actionable business intelligence. Here's how:
Automatic trend detection
Upload your data and Excelmatic instantly identifies positive/negative trends - no formulas needed.Smart alerts
Get notified when slopes change significantly (like when customer churn starts trending up).Multi-metric analysis
Compare slopes across different business metrics side-by-side to see what's really driving changes.Plain English explanations
Instead of just giving you a slope number, Excelmatic tells you what it means:
"Your customer acquisition cost slope increased 30% this quarter - consider reallocating ad spend."
Real-World Slope Wins
Here's how businesses use slope analysis with Excelmatic:
- E-commerce tracks product demand slopes to optimize inventory before peak seasons
- SaaS companies monitor feature adoption slopes to prioritize development
- Marketing teams compare campaign performance slopes to double down on what works
Beyond Basic Slope: Advanced Techniques Made Simple
Want to level up? Excelmatic handles complex analysis that would take hours in spreadsheets:
- Seasonal adjustments - See real trends beyond monthly fluctuations
- Slope comparisons - Is your growth rate better than competitors'?
- Forecasting - Predict where your metrics are headed based on current slopes
The Bottom Line
Understanding slope helps you spot opportunities and risks before they're obvious. While Google Sheets gives you the basic tools, Excelmatic turns slope analysis into a competitive advantage with:
✅ No-formula automation
✅ Instant visualizations
✅ Actionable recommendations
✅ Time-series forecasting
Ready to stop calculating and start understanding? Try Excelmatic free and see what your data's slope is telling you.


