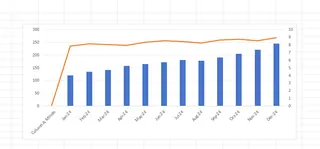
We’ve all been there – staring at an Excel chart where revenue numbers dwarf customer satisfaction scores, making both trends impossible to read. The fix? A second Y-axis. And here’s the game-changer: AI tools like Excelmatic now automate what used to be a manual headache.
Why Your Data Needs Dual Y-Axes
Single-axis charts work for simple data, but real-world metrics often clash:
- Revenue ($10,000s) vs. satisfaction scores (1-10)
- Temperature (°F) vs. ice cream sales (units)
- Stock prices ($) vs. trading volume (millions)
Excelmatic’s AI instantly recognizes when your data needs separate scales, suggesting dual-axis setups that would take 10+ clicks to create manually.
The Traditional Way (Before AI)
Prep Your Data
- Column A: Months
- Column B: Metric 1 (e.g., revenue)
- Column C: Metric 2 (e.g., satisfaction)
Create a Basic Chart
- Highlight data → Insert → Combo Chart
Manual Axis Setup
- Right-click a data series → Format → Secondary Axis
- Painstakingly adjust scales and labels

This method works but eats time – especially when tweaking multiple charts.
How Excelmatic’s AI Changes the Game
Upload Your Spreadsheet
- Excelmatic scans your data structure automatically
Ask in Plain English
Type: "Show revenue and satisfaction on separate Y-axes"Get an Optimized Chart
The AI:- Chooses ideal chart types
- Balances axis scales
- Adds clear labels
- Even suggests insights
Pro Tips for Clarity
Even with AI help, avoid these pitfalls:
- Overcrowding → Max 2-3 data series per chart
- Misleading scales → Let Excelmatic auto-align ranges
- Hidden trends → Use the AI’s "Spot Correlations" tool
Real-World Examples
Marketing Team
- Primary Y-axis: Ad spend ($)
- Secondary Y-axis: Click-through rate (%)
AI Insight: "CTR peaks at $5k monthly spend"
E-commerce Manager
- Primary Y-axis: Daily orders
- Secondary Y-axis: Avg. delivery time (hours)
AI Warning: "Delivery delays spike during 50+ order days"
Try It Yourself
Excelmatic’s free plan lets you:
✅ Generate 5 dual-axis charts monthly
✅ Get AI-powered optimization tips
✅ Export to PowerPoint with one click
Time Saver: What took 15 minutes manually now takes <60 seconds.
Why struggle with manual chart tweaks? Let Excelmatic’s AI build your dual-axis charts – your data (and your boss) will thank you.
About the Author
As a growth lead at Excelmatic, I help teams ditch spreadsheet frustration. Our AI handles the busywork so you can focus on insights, not formatting.


