As a User Growth Manager at Excelmatic, I’ve seen firsthand how calculated columns in Excel transform tedious manual work into efficient, automated processes. Whether you're analyzing sales, tracking budgets, or managing large datasets, calculated columns eliminate repetitive formula entry—saving time and reducing errors.
But what if you could go beyond basic Excel formulas? Modern AI tools like Excelmatic take data automation further by generating dynamic dashboards, detecting patterns, and even suggesting optimizations—all from natural language inputs. Let’s explore how to master calculated columns in Excel, and how AI can elevate your workflow.
What Is a Calculated Column?
A calculated column applies a single formula across an entire column, automatically updating results as data changes. Think of it as a built-in calculator for your spreadsheet:
- Example: Multiply "Price" by "Quantity Sold" to instantly calculate "Total Revenue" for every row.
- Advantage: No more copying formulas cell-by-cell—just define the logic once, and Excel handles the rest.
Why Use Calculated Columns?
- Time Savings: Automate repetitive calculations, especially in large datasets.
- Consistency: Uniform formulas reduce manual entry errors.
- Dynamic Updates: Edit the formula once to update all results instantly.
- Clarity: Keep spreadsheets organized and easy to audit.
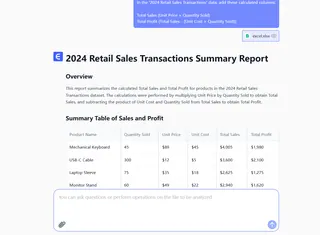
While Excel’s native calculated columns are powerful, AI-enhanced tools like Excelmatic add intelligence by:
- Auto-generating formulas from plain English (e.g., “Calculate profit margin”).
- Flagging inconsistencies or outliers in your data.
- Building interactive dashboards without manual setup.
How to Create a Calculated Column in Excel
Step 1: Prepare Your Data
Ensure your dataset has headers (e.g., "Product," "Price," "Quantity").
Step 2: Select the Target Column
Click the header of the column where you want the calculated results (e.g., "Total Sales").
Step 3: Enter the Formula
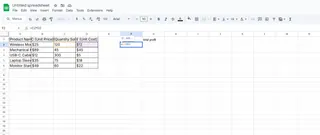
In the first cell (e.g., D2), type your formula. For example:
=B2*C2 // Multiplies Price (B2) by Quantity (C2)

Press Enter, and Excel auto-fills the formula down the entire column.
Step 4: Verify Results
Check that calculations update correctly when you modify the source data.
Advanced Tips & AI Shortcuts
Common Use Cases
- Financial Analysis: Profit margins, discounts, or tax calculations.
- Performance Metrics: Growth rates, averages, or YoY comparisons.
How Excelmatic Enhances This Process
- Formula Suggestions: Describe your goal (e.g., “Calculate 10% discount”), and Excelmatic writes the formula for you.
- Error Detection: Automatically highlights mismatched units or outliers.
- Dashboard Automation: Transform calculated columns into visual reports with one click.

Pro Tip: For large datasets, pair Excel’s calculated columns with Excelmatic’s AI engine to clean data, detect trends, and generate insights—all without manual scripting.
Beyond Excel: The AI Advantage
While Excel’s calculated columns are foundational, modern data teams rely on AI tools to:
- Scale Analysis: Handle millions of rows with real-time processing.
- Collaborate: Share live dashboards with stakeholders.
- Predict: Forecast trends using historical data patterns.
Try Excelmatic Free: Import your Excel sheet, describe your goals, and let AI build calculations and visuals for you—no formulas required.
Key Takeaways
- Calculated columns automate repetitive Excel formulas.
- AI tools like Excelmatic accelerate the process with natural language inputs and error-proofing.
- Combine Excel’s basics with AI to unlock faster, smarter data workflows.
Ready to upgrade your data game? Explore Excelmatic’s AI-powered features today.


