Key takeaways:
- AI content analysis tools parse your historical performance data—exported from platforms like Instagram or TikTok as Excel/CSV files—to uncover hidden patterns and audience preferences.
- These tools automatically transform complex spreadsheets into intuitive visuals like word clouds and bar charts, letting you see at a glance which topics are most popular and which content formats drive the most engagement.
- By leveraging AI, content creators can shift from guesswork to data-driven decision-making, dramatically increasing their chances of creating viral content while saving hours of brainstorming time.
You have a brilliant idea, but in an age of information overload, how do you make it stand out in the endless scroll of Instagram, TikTok, and YouTube? For any content creator or social media manager, the most dreaded daily question is: "What should I post today?" You stare at a blank screen, or endlessly scroll through competitors' feeds, hoping for a spark of inspiration.
This is where AI-powered content analysis and visualization tools come in. They do more than just crunch numbers—they understand your past successes and failures, helping you find the "secret formula" that truly resonates with your audience. Below, we’ll walk you through how to use these top-tier AI tools to end your content rut and let data guide your next viral hit.
What are AI Content Analysis Tools?
AI content analysis tools are applications that transform the data you export from social media platforms (as Excel or CSV files) into actionable insights. They combine artificial intelligence, data visualization, and natural language processing to automate the entire process of cleaning, analyzing, and presenting your data.
They don’t just show you a chart—they help you understand your audience. You no longer have to manually sort through an Excel sheet with hundreds of rows to spot a trend. You simply upload the data files exported from YouTube Studio, TikTok's Creator Center, or your Instagram Insights, and the AI helps you answer critical questions: Which keywords drove the most engagement? Are videos or carousels more popular with my followers?
For example, instead of vaguely recalling that "a pet-related post did well last time," an AI tool can analyze all your historical post data and generate a word cloud, clearly showing you that "pet care," "unboxing," and "DIY" are your three most engaging content pillars.
Features of AI Content Analysis Tools
Designed for creators and marketers like you, AI content analysis tools make complex data analysis feel as easy as chatting with a friend. Here’s a sample of what these tools can do:
- Historical performance analysis: AI automatically calculates key metrics for every piece of content you've uploaded, like engagement rate, follower growth, and video completion rate.
- Topic & keyword visualization: Extracts high-frequency words from your top-performing titles and captions to generate word clouds, giving you an intuitive look at winning content themes.
- Format performance comparison: Automatically generates bar or column charts to clearly compare the average performance of different formats, such as videos, carousels, and single-image posts.
- Natural language queries: You can ask questions in plain English ("Show me my top 5 most liked posts from last month"), and the tool will instantly filter your data or generate a chart.
- Automated report generation: With one click, you can export your analysis into a polished, visual report, making your presentations to clients or managers more compelling.
- Competitor data analysis: You can upload manually compiled Excel sheets of your competitors' top-performing content and use the same AI-powered tools to deconstruct their success strategies.
Benefits of Using AI Tools for Content Creation
AI content analysis tools are revolutionizing how creators work. They make data accessible to everyone, not just "analysis gurus," turning it into a creative engine you can rely on.
- Data-driven creativity: Say goodbye to guesswork. Every content decision you make is backed by your own historical data.
- Increased efficiency: Frees you from the tedious work of data cleanup and manual analysis, giving you more time to focus on creating high-quality content.
- Higher engagement rates: Because you have a deeper understanding of what your audience loves, your content will resonate better, leading to more likes, comments, and shares.
- Clearer content direction: Develop your own sustainable, repeatable "viral formula" instead of relying on one-off luck.
- Empowers creators of all skill levels: No need to learn complex Excel formulas or data science theory. Anyone can get started quickly and make professional-level decisions.
- More persuasive reporting: You can clearly explain to your boss or team why you chose a specific topic and what results you expect.
What to Consider When Choosing an AI Content Analysis Tool
Adopting a new tool means changing your workflow, but the return on this investment is immense. Your content creation will become more efficient and precise, and those daunting spreadsheets will transform into your personal goldmine of ideas.
Data Processing Capabilities Your tool needs to handle Excel/CSV files from different platforms with ease. Look for tools that can intelligently identify data columns and automatically clean common errors (like inconsistent formats or empty cells). The best tools even let you merge multiple files for a holistic analysis.
Ease of Use For a content creator, an intuitive interface is everything. An ideal tool should feel like using a smart app, not a complex piece of software. A natural language query feature is a key indicator of user-friendliness.
Visualization Quality and Types Can the tool generate charts that are clear, beautiful, and insightful? Check if it supports visualization types that are crucial for social media analysis, such as word clouds, bar charts, trend lines, and Sankey diagrams.
Depth of Analysis Can the tool only perform simple sorting and summing, or can it help you calculate more advanced metrics like "follower conversion cost per post" or "average engagement rate by topic"? Choose a tool that can grow with you and offer deeper insights.
Pricing and Value for Money For individual creators or small teams, budget is a real-world constraint. Evaluate the tool's pricing model and choose a solution that is both affordable and provides core value at your current stage.
Top 5 AI Content Analysis & Visualization Tools
The market offers many powerful AI data visualization tools. While not all are built specifically for social media managers, their core functionalities can be cleverly adapted to solve the problem of content ideation. From industry giants to flexible newcomers, there’s a solution for you.
1. Excelmatic

If you value ultimate simplicity and efficiency, and your daily work revolves around Excel, Excelmatic is the "supercharged plugin" designed for you. It isn't bloated with the complex features of large BI tools; it focuses on one thing: letting you handle all your Excel/CSV data tasks through conversation. For a social media manager, this means you can find content ideas from your exported data in the most intuitive way possible.
- Analyze like a conversation: Just type "Show me the posts with 'outfit' in the title and the highest number of likes" in the chat box, and Excelmatic will instantly filter and highlight the results for you.
- One-click smart cleaning: Upload messy Excel files from different platform backends, and say "Unify all date formats and fill blank engagement numbers with 0." Your data becomes clean in seconds.
- Instant chart generation: Tell it "Give me a pie chart showing the proportion of videos versus image posts," and a clear chart appears immediately.
- Lightweight and focused: No steep learning curve, ready to use in an instant. It’s the smoothest bridge from manual Excel work to AI-powered data analysis.
2. Microsoft Power BI

If Excel is a manual car, Power BI is an automatic with an AI assistant. As part of the Microsoft ecosystem, it handles Excel files flawlessly. Simply import your data, and its AI features can help you automatically discover anomalies and trends. You can use its "Q&A" feature to ask questions directly, like "show average likes by content theme," and it will recommend the best chart for you.
- Natural language insights: Ask questions in plain English, and Power BI will try to understand and generate a visual answer.
- Smart Narratives: It can automatically generate text summaries for your charts, helping you "read" the story behind the data—perfect for writing weekly reports.
- Powerful data cleaning: The built-in Power Query feature is incredibly robust for cleaning "dirty data" from platform exports.
- Seamless Excel integration: If you're already familiar with Excel, getting started with Power BI will be a smooth transition.
3. Tableau

Tableau is the "artist" of the data visualization world, known for creating beautiful, highly interactive charts. Its AI assistant, "Ask Data," also allows you to explore using natural language. As a social media manager, you can use it to create your own "Content Idea Dashboard" and visually compare the performance of different content formats.
- Drag-and-drop exploration: Build your analysis like you're playing with LEGOs, dragging different data dimensions (like "title keywords" or "content format") onto the canvas to see instant results.
- Smart chart recommendations: The AI intelligently suggests the most suitable chart type based on the data you select, so you never have to wonder "which chart should I use?"
- Powerful Story feature: You can string multiple charts together to create a "data story," which is perfect for monthly reviews or project reports.
4. Zoho Analytics
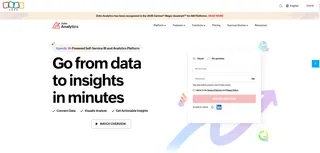
If you're looking for a tool that offers great value and is extremely beginner-friendly, Zoho Analytics is worth a look. Its AI assistant, "Zia," acts like your patient "data buddy," not only answering your questions but also proactively offering insights. Upload your content data Excel, and it might even automatically tell you, "'Tutorial' type content has a significantly higher comment count than average."
- Zia AI insights: Chat with Zia as if it were a real person, and it will respond with charts and text.
- Automated data modeling: Even if you upload multiple spreadsheets, it can help you guess and establish relationships between them.
- Predictive analytics: It can use your past posting data to forecast where your key metrics (like views) will likely land in the next period.
5. Observable
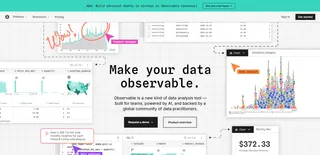
Observable is a more modern, collaborative option that works like a "data notebook." If you don't mind a light touch of code, it offers immense freedom. You can import your data and then leverage thousands of ready-made visualization code blocks from the community (like beautiful word clouds or dynamic bar chart races) to analyze your content in visually stunning ways.
- AI-assisted exploration: The AI suggests relevant analysis code snippets and visualization options based on your data's structure.
- Real-time collaboration: Just like using a Google Doc, you and your colleagues can work on the same analysis in a single "notebook."
- Reusable templates: Once you create a content analysis template you love, you only need to swap out the data source each month, and all your analyses will update automatically.
AI for Content Strategy FAQs
How is this different from just using filters and sorting in Excel? Filtering and sorting in Excel are manual and mechanical. AI tools let you ask questions in natural language, automate calculations and visualizations, and proactively discover patterns you might have missed. It elevates you from an "operator" to a "strategist." The efficiency and depth are on a completely different level.
Do I need to be a data analyst to use these tools? Not at all. The core design philosophy of these tools is to serve non-technical users. They replace complex formulas and code with intuitive interfaces and AI assistants, allowing every content creator to reap the benefits of data analysis.
Where do I get the data to analyze? Nearly all major social media platforms provide data export features for creators. You can find and export detailed, post-by-post performance data as Excel or CSV files from sections like the "Analytics" tab in YouTube Studio, the "Creator Center" in TikTok, or the "Insights" section of your Instagram professional account.
Accelerate Your Content Insights with Excelmatic
It's time to stop wrestling with Excel formulas and endless rows of data. Excelmatic puts powerful artificial intelligence into a beautifully simple chat interface, allowing you to handle data analysis as easily as talking to an expert colleague. From data cleaning to visualization and smart insights, all it takes is a few simple English commands.
End your content rut and give your time back to creativity. Designed for efficiency-minded creators and marketers like you, Excelmatic requires no technical background to get started.
Key Features:
- Conversational Analysis: No formulas to remember. Just say what you need.
- Intelligent Cleaning: Automatically handles messy, inconsistently formatted spreadsheets.
- Instant Visualization: Generate beautiful, clear charts with a single sentence.
- Lightweight Design: No installation, no complex setup. It all works in your browser.
Sign up for a free trial of Excelmatic today and experience what it's like to talk to your data. Make AI your secret weapon for creating your next viral hit!


