In a world where data pours in from every survey, form, or onboarding spreadsheet, making sense of it means more than just cleaning columns. It’s about classification. It’s about scoring. And it's a real headache—until it isn't.
Let’s talk about that moment when someone asks: “Can you group all clients into performance bands based on scores?” It sounds simple. But if you’ve done this in Excel before, you know the truth.
Traditional Classification in Excel: The Grind
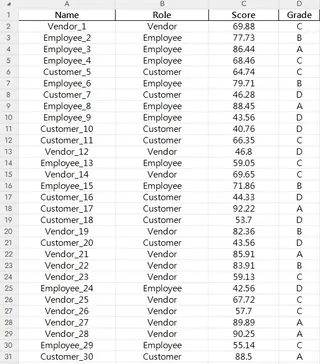
Let’s say you’re given a spreadsheet with 100 names, their roles (Customer, Employee, Vendor), and a numeric score between 0–100.

You now have to:
- Define logical rules for bands like A (90+), B (80–89), etc.
- Create a nested
IFformula orVLOOKUPtable to assign grades. - Apply conditional formatting for visuals.
- Filter and count how many people fall into each grade.
- Create a chart to summarize performance per role.
Each step feels small. But they add up. One mistake in a formula? One wrong range in a filter? It ruins everything.
Example issues:
- Some scores are decimals, and your banding doesn’t account for edge values.
- Your role column has inconsistent capitalization—“customer” vs. “Customer”.
- You forgot to lock cell ranges in your formula—so copying them broke logic.
Now imagine doing this monthly. Or with new roles. Or adjusting thresholds. Manual Excel quickly turns into a logic spaghetti bowl.
Ask Excelmatic Instead
Let’s reset. You upload the same sheet into Excelmatic. Then you just ask:
“Summarize performance by role and grade.”
And this is what you get back:
A clean pivot-style table with role-based grade counts.
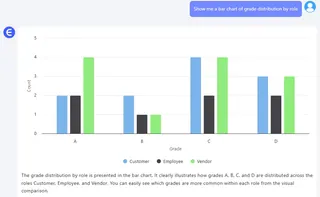
A Bar Chart showing grade distribution per role.
A written summary
No formula writing. No chart dragging. Just a conversation.
Sample Questions to Ask Excelmatic
“How many employees received a grade below B?” → Useful for identifying who needs upskilling.

“Show me a Bar Chart of grade distribution by role.” → Visual insights, instantly created.

Comparison: Manual vs. Excelmatic
| Task | Traditional Excel | Excelmatic |
|---|---|---|
| Grading | Manual IF formulas | Just describe your rules |
| Classification by role | Create pivot tables | Auto-grouped |
| Visuals | Charts from scratch | Instantly generated |
| Summary insights | You write them | It writes for you |
It’s not about replacing Excel. It’s about skipping the grunt work and focusing on what matters—interpreting the insights, not wrestling the spreadsheet.
Final Thought
Spreadsheets weren’t built to reason. They calculate. You reason. With Excelmatic in your workflow, you spend less time formatting columns and more time leading discussions that change the business.
Click on the links below to see past highlights:
Compare Ad Channel Sales with a Bar Chart in Excel AI
Excel Data Cleanup Made Simple: Unifying Formats with Excelmatic
KPI Metric Analysis Made Easy with Excelmatic: From Chaos to Clarity


