Key Takeaways:
Finding your "Top 10 Bestsellers" in Excel from raw order data is a painful multi-step process: PivotTable, sort, filter, and then manually create a chart.
Excelmatic understands complex, layered commands like "top 10 bestselling products." Simply upload your raw data and ask your question in one sentence to get an instant visualization.
This transforms your role from a data
processorto a businessstrategist, shrinking a 15-minute task into 15 seconds and enabling you to make data-driven decisions at the speed of conversation.
As an e-commerce manager, you've just downloaded the latest quarterly order report—a sprawling spreadsheet with thousands upon thousands of rows. Right on cue, your boss walks over and asks the million-dollar question: "What were our top 10 bestselling products this quarter? I need a chart."
In Excel, this isn't a simple question. It's the start of a tedious data gauntlet.
- Create a PivotTable: To sum up the sales quantity for each unique product.
- Sort the Data: Arrange the summed quantities in descending order.
- Filter for the Top 10: Dig into the PivotTable's "Value Filters" to find and apply the "Top 10" option.
- Build the Chart: Finally, select the filtered data and insert a bar chart, then spend more time formatting it to be presentable.
This sequence is not only slow and cumbersome but also prone to errors at every step. All you wanted to know was, "What are our top 10?" Why can't you just ask?
From Data Processor to Business Strategist
The fundamental problem with traditional tools is that they force you to be a data operator. You must manually translate your business question ("Who are my top 10 bestsellers?") into a long series of mechanical clicks and commands.
Excelmatic revolutionizes this workflow by letting you stay focused on the business question. It understands your commercial intent—including complex analytical logic like "best," "top," and "highest"—allowing you to ask questions directly.

How Does the AI Understand "Top 10"?
When you issue your command, the AI performs that entire complex Excel routine for you in seconds:
- Intelligent Aggregation: It automatically identifies all unique products and sums their sales quantities.
- Instant Sorting & Filtering: It ranks the results in-memory and precisely extracts the top 10 items.
- Automatic Visualization: It presents these top 10 results in a clean, easy-to-understand bar chart.
Now, finding your bestsellers is just three simple steps away.
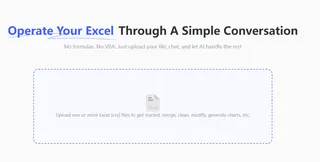
Step 1: Upload Your Raw Order Data
Drop in the raw order export file straight from your e-commerce platform. No cleaning or prep is required.
Step 2: Ask Your Core Business Question
In the chat box, ask your question just like you would to a data analyst:
"Create a bar chart showing the top 10 bestselling products by sales quantity."

Step 3: Get Your Bestseller Leaderboard Instantly
A perfect, accurate "Top 10 Bestsellers" bar chart appears instantly. You can immediately use it in your report for your boss or use it to inform your next inventory and marketing decisions.
You're now just one question away from your most important insights.
Why This Approach is a Game-Changer
It fundamentally changes how you work. You no longer spend 80% of your time figuring out how to wrangle the data. Instead, you can spend 100% of your time exploring why the data looks the way it does:
- Why are these products the bestsellers? Was it a promotion or organic demand?
- How are our long-tail products performing? (Instantly ask: "Show me the 10 worst-selling products.")
- What do our top sellers in a specific category have in common? (Follow up with: "What are the top 5 bestsellers in the 'Apparel' category?")
This ability to have a real-time conversation with your data dramatically accelerates your decision-making.
F.A.Q.
Q: Can I rank by revenue instead of sales quantity?
A: Absolutely. Just change your command: "Show the top 10 products by total revenue."
Q: Can I look for the "Top 5" or "Top 20" instead?
A: Yes. The number '10' is completely flexible. The AI understands any number you specify.
Q: My raw data is messy and has blank cells. How is that handled?
A: The AI engine in Excelmatic is designed to automatically ignore empty or invalid cells during calculations, ensuring your results are accurate.
Get Back to the Business of Your Business
Stop letting tedious spreadsheet operations be a barrier to business insight. Let AI handle the repetitive work so you can focus on identifying trends and driving strategy.
Try Excelmatic for free and start having a conversation with your data.

