In financial work, the production of budget statements is often a headache. Cumbersome data processing, complex formula calculations, and the dazzling chart production, the slightest error may occur. But don't worry, today we will introduce you to a super-practical tool - Excelmatic, which can make your budget report production becomes easy and fun!
Getting to know Excelmatic
Excelmatic is an Excel analysis tool that perfectly combines AI and data analysis. You don't need to master complex Excel functions or data analysis skills, you can easily get insights from Excel files just by way of natural language conversations. Isn't that amazing? It's like having a little intelligent assistant working with your data for you.
The Magic of Excelmatic in Budget Reporting
1. Data Processing and Analysis
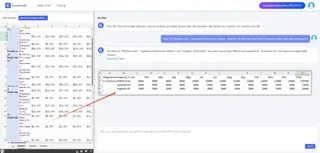
When creating budget reports, we often need to organize and analyze a large amount of data. Excelmatic provides a variety of data processing functions, such as sorting, filtering, finding and replacing, etc., so that you can quickly find the information you need. Just like in the ocean of data, it helps you quickly locate that important fish.
Example : If you have a table containing budget data from many departments and want to filter out data from a specific department for analysis, you can get the results instantly with a simple operation in Excelmatic.
2. Formulas and Functions
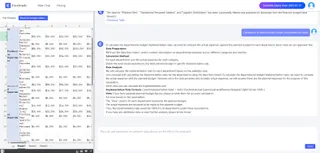
Formulas and functions are indispensable for complex budget calculations, and Excelmatic supports a wide range of mathematical, statistical and logical formulas and functions, allowing you to perform various calculations with ease. Moreover, you don't need to manually enter complex formulas, it will automatically generate them according to your needs, isn't it very convenient?
Example: To calculate a department's budget execution rate, simply enter the appropriate commands into Excelmatic, and it will automatically calculate the results for you, eliminating the need for tedious calculations.
3. Charting
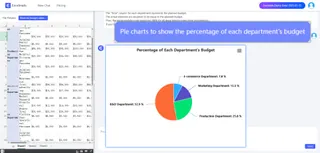
A good chart can make the budget report more intuitive and easy to understand. Excelmatic can generate Bar Charts, pie charts, line charts and other types of charts according to the data, so that you can easily visualize the data. Moreover, its charting function is very simple, so even if you are a novice, you can get started quickly.
Example : When you want to show the percentage of the budget of each department, select the pie chart function, Excelmatic will be based on your data to generate a clear and beautiful pie chart, so you can understand the budget allocation of each department at a glance.
4. Pivot Tables
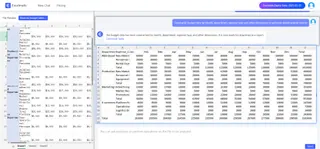
Pivot table is a common tool in financial work, which can help us quickly summarize and analyze a large amount of data. Excelmatic allows you to easily create pivot tables to summarize and filter the data by different dimensions, which makes your budget reports more flexible and versatile.
Example: You can summarize budget data by month, department, expense type and other dimensions to quickly generate a variety of reports to provide powerful support for budget control and decision-making.
How to use Excelmatic
1. Register and login to the official website
2. Upload Excel file
3. Ask questions in natural language
4. Get Analytics Reports
Conclusion
Excelmatic, as a powerful Excel analysis tool, brings unprecedented convenience and efficiency to finance professionals. It can not only help you easily create budget reports, but also provide strong support for your financial management and decision-making. Whether you are a novice or a seasoned professional, try Excelmatic and make it your right hand at work. Start the intelligent Excel analysis journey with Excelmatic now!


