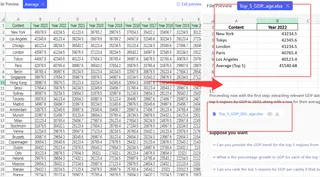
"What's the average selling price of our top 5 products?" Faced with a seemingly simple question like this, the real time-waster isn't the calculation itself. It's accurately identifying those "top 5 products" from hundreds or thousands of rows of data first.
Key Takeaways:
- The Challenge: Calculating the average for a specific subset of data (like the Top N or a certain category) requires complex filtering, sorting, or advanced functions.
- The Old Way: In Excel, this means sorting, manually selecting cells, or wrestling with complex array formulas like
AVERAGE(LARGE(...)). The process is tedious and error-prone. - The AI Way: Describe your goal in one sentence, and the AI automatically performs both the filtering and calculation, delivering the answer directly.
Imagine you have a spreadsheet with historical GDP data for every region worldwide. Your manager asks, "What was the average GDP of the top 5 regions in 2022?"
In Excel, your workflow would look like this:
- Filter by Year: First, you'd filter the "Year" column to show only "2022."
- Sort the Data: Next, you'd sort the "GDP" column in descending order to find the five largest values.
- Select and Calculate: You would manually select the GDP cells for those top five regions, then either read the average from Excel's status bar or type
=AVERAGE()in a blank cell and select them again.
This entire process involves multiple steps: filtering, sorting, selecting, and calculating. And if your manager follows up with "What about the bottom 5?" or "How about for 2021?", you have to repeat the entire tedious workflow. Worse, with large datasets, manual sorting and selection are highly prone to error.
Ask a Question, Don't Build a Formula
In the past, you had to handle everything from locating the data to performing the calculation. Now, you can hand it all over to AI.
Excelmatic is designed to understand and execute complex commands that combine sorting, filtering, and calculation logic in one go.
| Comparison | Traditional Excel Calculation | Excelmatic |
|---|---|---|
| Workflow | Filter/Sort → Select → Calculate (Multi-step process) | Ask a Question (One seamless step) |
| Method | Manual actions or complex formulas | A single plain-English command |
| Flexibility | Low; changing criteria means starting over | High; just change a few words to re-analyze |
| Core Output | A number in a cell | A clear answer with context |
Excelmatic frees you from the drudgery of formulas and functions, allowing you to focus on the business insights behind the data.

Get Your Precise Average in Three Steps
Let's use the "calculating the average GDP of the Top 5 regions" scenario to see how Excelmatic gets the result in seconds.
Step 1: Upload Your Spreadsheet
Simply upload the complete data file containing fields like "Region," "Year," and "GDP."

Step 2: Ask Your Question
In the chat box, describe what you need:
“Extract the data for the top 5 regions by GDP in 2022 and calculate their average GDP.”

Step 3: Get Your Answer
Once it receives the command, the AI automatically starts filtering the data, finds the result, and returns the calculation to you. The entire process is hands-off and takes just a few seconds.

Frequently Asked Questions (FAQ)
1. Can I calculate more complex averages? Yes. You can provide more specific criteria, such as: "Calculate the average GDP for the top 3 countries in 'Asia' in 2022," or "Calculate the average for the bottom 5 in 'Europe'."
2. Can it do more than just calculate averages? Of course. You can use the same logic to get the Sum, Count, Max, Min, and more. For example: "Count how many regions had a GDP over 1 trillion in 2022."
3. How is this different from a PivotTable? PivotTables are great for summarizing data by fixed categories, but they are very clumsy for handling dynamic calculations like "Top N." The strength of Excelmatic is its flexibility to instantly answer these kinds of ad-hoc, exploratory questions.
Your Value Is in Asking Questions, Not Doing Calculations
Free your energy from the tedious steps of "how to calculate" and focus on the more valuable questions of "what to calculate" and "why." The AI handles the execution; you handle the thinking.
Let questions replace filtering and formulas.
Try Excelmatic now and uncover key metrics with a single sentence!


