Key Takeaways:
- AI Simplifies Data Stories: AI tools use natural language to turn complex data into clear visuals, making it easy for anyone to analyze information.
- Top Tools Available: Key players include Excelmatic, ThoughtSpot, Tableau, Power BI, Qlik Sense, Mokkup, Domo, and Google Looker.
- Best for Most Users: For its ease of use and powerful features, Excelmatic is the top recommendation for effortlessly creating visuals from spreadsheets.
When data becomes complex, we need better ways
“On its own, data has zero value,” says data expert Bill Schmarzo. He’s right. The real value isn't in the raw numbers; it's in the story they tell and the decisions they inform.
We have all experienced this situation: staring at endless spreadsheet data, trying to sort things out. Whether you are a market analyst reporting marketing campaign results to leadership, a project manager sharing quarterly performance with clients, or a researcher studying experimental data patterns, the challenge you face is the same: raw numbers alone cannot tell compelling stories.
Data visualization is the key to transforming complex information into clear information. By transforming abstract numbers into intuitive charts and dashboards, we can instantly reveal trends, showcase progress, and uncover insights that were originally hidden in spreadsheets.
However, traditional methods often require specialized skills that not everyone possesses —— such as superb Excel skills, a good sense of design, and the patience to manually create professional level visual charts.
The core features of modern AI data visualization tools
Natural Language Processing (NLP): Enables computers to understand human language, and users can interact with visual tools through voice commands. No need to write complex query statements or operate complex technical interfaces, just enter "Display sales trends for various regions in 2023" to obtain visual charts and easy to understand summaries.
Interactive Visualization: Excellent AI data visualization tools should provide interactive dashboards that allow users to delve deeper into data and customize views to meet their own needs. Although visual charts can be automatically generated, users still need to be flexible in customizing and optimizing them.
Automated Insights: Efficient AI tools not only aggregate data, but also highlight key metrics and notify you when significant changes occur. Advanced features such as anomaly detection and root cause analysis help identify problems in real-time, giving you the background information you need to take action quickly and confidently.
Implementing data integration and real-time updates: Deploying artificial intelligence to support seamless integration with various data sources. By completing deployment, automated real-time updates can be obtained to maintain the latest and relevant visual content.
Unlock Your Data's Story with These 8 AI Tools
After reviewing the landscape and testing numerous platforms, here are the 8 best AI tools that can help you unlock the stories hidden in your data.
Excelmatic:
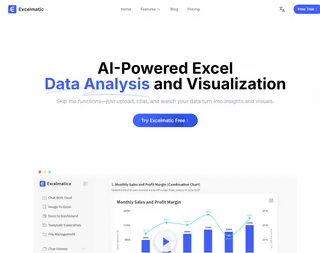
A game-changer for anyone who lives in spreadsheets. It integrates directly with Excel, using AI to instantly turn your rows and columns into a variety of clean, professional charts through simple conversational commands.
ThoughtSpot:
This tool is a powerhouse for search-driven analytics. Its "Ask ThoughtSpot" feature works like a search engine for your data, allowing you to ask complex questions in plain English and get accurate visual answers in seconds.

Tableau:
A long-standing leader in the space, Tableau has infused AI through features like "Tableau Pulse," which provides automated data narratives and trend explanations, making it easier to understand the "why" behind the "what."

Power BI:
Microsoft's robust business analytics suite excels with its deep integration into the Office 365 ecosystem. Its AI capabilities, such as smart narrative and key influencer visuals, help you quickly create and share impactful, enterprise-ready reports.

Qlik Sense:
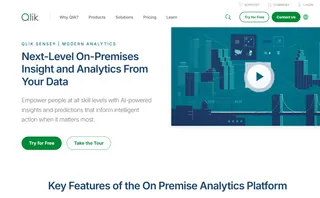
Known for its powerful associative engine, Qlik Sense goes beyond simple querying to uncover hidden relationships in your data. Its AI suggests insights and automatically creates relevant visualizations based on your exploration.
Mokkup:
This tool specializes in speed and simplicity for creating dashboard wireframes. Its AI assists by suggesting optimal chart types and layouts, allowing you to rapidly prototype and iterate on your data story's design.

Domo:
As a cloud-based platform, Domo brings together data integration, business intelligence, and AI in one place. It automates data preparation and provides predictive insights and alerts, ideal for real-time business monitoring.

Google Looker:
Built on Google's cloud infrastructure, Looker handles massive datasets with ease. Its strength lies in its connected, curated data model and integrated AI services like BigQuery ML for building and deploying machine learning models directly alongside your visuals.

| Tool Name | Core Functionality Description | Key Features |
|---|---|---|
| Excelmatic | AI-powered spreadsheet analysis and visualization | Natural language interaction, instant chart generation, automated data cleaning & formula building, no installation required |
| ThoughtSpot | Search-driven analytics and visualization | Natural language search, designed for non-technical users, fast visual answers |
| Tableau | Mature business intelligence and visualization platform | AI features (Tableau Pulse), automated data narratives & trend explanations, easy understanding of data reasoning |
| Power BI | Microsoft's business analytics suite | Deep Office 365 integration, AI features (smart narratives, key influencer visuals), enterprise-ready reporting |
| Qlik Sense | Association engine-driven data analysis | Powerful associative engine, reveals hidden data relationships, AI-assisted insights & automated visualization |
| Mokkup | Specializes in dashboard wireframing | Rapid wireframe creation, AI-assisted chart type and layout suggestions, quick prototyping and design iteration |
| Domo | Cloud-scale business intelligence platform | Data integration/BI/AI integration, automated data preparation, predictive insights & alerts, real-time monitoring |
| Google Looker | Cloud-data based business intelligence platform | Handles massive datasets, unified semantic layer (LookML), integrated AI services (BigQuery ML), supports 50+ SQL dialects, real-time data experience |
Why Excelmatic is My Top Recommendation
Its biggest advantage lies in its intuitive conversational interface. You don't need to be a data scientist or design expert, just describe what you want to see. You can tell it to "highlight the best performing area," "switch to line chart," or "use deeper blue," and it will understand and execute seamlessly. The user experience is not so much about using software as it is about collaborating with a helpful colleague.
In addition, the functionality of Excelmatic goes far beyond visualization. It is a comprehensive tool that can handle data cleaning, basic analysis, and anomaly detection. This makes it an ideal entry-level choice for beginners and saves a lot of time for professionals who don't want to switch between five different applications. It can directly meet your needs and significantly improve your work efficiency, with a smooth learning curve.

Frequently Asked Questions (FAQ)
Q1: For marketing or operations staff with no data analysis background, which tool is the quickest to get started with?
A: We primarily recommend Excelmatic and ThoughtSpot. Their design philosophy is to empower non-technical users. You just need to ask business questions as if using a search engine, and you'll get visual answers instantly, requiring almost no prior training.
Q2: The article mentions that Excelmatic can also handle data cleaning and analysis. Does this mean it can replace some of Excel's functions?
A: To be precise, it enhances and complements Excel. Excelmatic focuses on using AI to automate steps that would otherwise require manual operations or complex formulas in Excel, such as data cleaning, outlier detection, and quick summarization. It aims to help you use Excel more efficiently, not replace it entirely.
Q3: Do these tools require coding skills to use?
A: Not at all. New-generation AI tools like Excelmatic and ThoughtSpot are specifically designed with natural language interfaces. Users can simply ask questions in everyday language to get professional-level visualization results, completely eliminating the technical barrier.
Visualize Smarter, Not Harder
The time has come to say goodbye to data chaos and welcome clear insights.
After trying various data visualization tools, we're confident Excelmatic will become your final choice —— because it understands your work habits, respects your time, and most importantly, genuinely helps you discover the business value hidden in your data.
Don't just visualize —— understand. Start your conversation with data using Excelmatic and turn every spreadsheet into a story waiting to be told.

