
Introduction: Simplifying Excel Data Analysis with Excelmatic
Excel is a powerhouse for managing data, but when it comes to analyzing sales figures—like tracking apple sales in Germany or orange trends in Spain—things can get messy fast. Manual analysis often means wrestling with complex formulas, spending hours on setup, and hoping you don’t miss a decimal point. For businesses relying on timely, accurate insights, this old-school approach can be a bottleneck.
What if there was a better way? Meet Excelmatic, an AI-powered Excel tool that transforms how you interact with spreadsheets. With Excelmatic, you can skip the formulas, ask questions in plain English, and get instant, reliable answers. In this guide, we’ll dive into how Excelmatic simplifies analyzing a fruit sales dataset—covering sales reps, fruit types, regions, and monthly data from October 2024 to September 2025. Whether you’re an Excel beginner or a seasoned pro, this tool makes data analysis fast, accurate, and accessible.
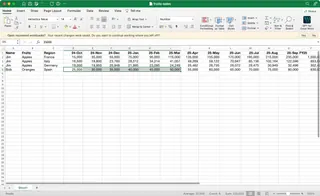
The Old Way: The Complexity of Manual Excel Analysis
Picture this: You’re a sales manager tasked with finding the year-to-date (YTD) sales of apples in Germany from October 2024 to March 2025. Your dataset includes columns for Sales Reps (Jim, Bob), Fruits (Apples, Oranges), Regions (France, Italy, Germany, Spain), and monthly sales figures. Here’s what the manual process looks like in traditional Excel:
- Locate the Data: Open your sprawling spreadsheet and identify the relevant columns—Fruit, Region, Date, and Sales. With thousands of rows, scrolling alone takes time.
- Filter the Dataset: Apply filters to isolate rows where Fruit = "Apples" and Region = "Germany." If the data isn’t perfectly formatted, you might need to clean it first (e.g., fixing inconsistent region names like "Germ." vs. "Germany").
- Handle Dates: Ensure the Date column is in a recognizable format. If it’s text (e.g., "Oct 2024"), you’ll need to convert it or write a formula to extract the right range—October 2024 to March 2025. This could mean using helper columns or advanced date functions.
- Calculate the Total: Use a SUMIFS formula like
=SUMIFS(Sales_Column, Fruit_Column, "Apples", Region_Column, "Germany", Date_Column, ">="&DATE(2024,10,1), Date_Column, "<="&DATE(2025,3,31)). If you’re not comfortable with formulas, you might opt for a pivot table, which requires setting up fields, filters, and date ranges manually. - Double-Check: One typo in your formula or a misclicked filter, and your total is off. You’ll need to verify every step, especially with large datasets where errors hide easily.
This process can take hours, depending on your Excel skills and the dataset’s size. For someone without advanced knowledge—say, a small business owner or a junior analyst—it’s a daunting task. Even experts can slip up, leading to inaccurate insights that misguide business decisions. And if you need to repeat this for oranges in Spain or monthly trends in France? Multiply that effort.

The Excelmatic Way: Effortless Sales Data Insights
Now, let’s tackle the same task with Excelmatic, the AI-powered tool that’s revolutionizing Excel data analysis. Here’s how it works:
- Upload Your File: Head to the Excelmatic website, sign up for free, and upload your fruit sales dataset (in CSV or XLSX format). The AI instantly recognizes columns like "Fruit," "Region," "Date," and "Sales"—no manual prep needed.
- Ask in Plain English: In the chatbox, type: "How many apples were sold year-to-date (Oct’24 – Mar’25) in Germany?" That’s it—no formulas, no filters.
- Get Instant Results: Excelmatic’s AI scans the data, filters for Apples and Germany, sums the sales from October 2024 to March 2025, and delivers the exact total in seconds. No guesswork, no errors.
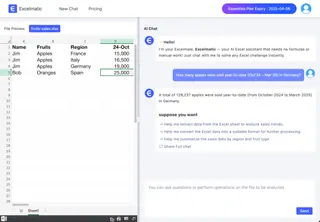
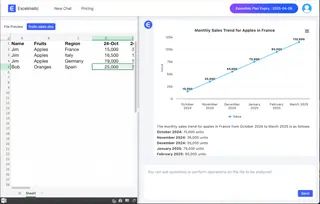
Want more? Ask, "What’s the total number of oranges sold in Spain during the same period?" or "Show me the monthly sales trend for apples in France." Excelmatic processes each query effortlessly, giving you answers and even visualizations like charts—all without touching a single formula.
Why Excelmatic Beats Manual Analysis: A Detailed Comparison
Excelmatic doesn’t just save time—it eliminates complexity and democratizes data analysis. Here’s a breakdown of how it stacks up against the old way:
| Aspect | Manual Excel Analysis | Excelmatic AI |
|---|---|---|
| Time Required | Hours of setup, filtering, and checking | Seconds per query |
| Skill Level | Advanced (formulas, pivot tables) | Beginner-friendly |
| Error Risk | High (typos, filter mistakes) | Low (AI ensures accuracy) |
| Flexibility | Rigid; new questions mean new setups | Ask anything, anytime |
| Collaboration | Share bulky files or redo work | Export insights as charts or PDFs |
With Excelmatic, easy Excel analysis becomes reality. You’re no longer bogged down by technical hurdles—instead, you’re free to focus on what the data means for your business.
Benefits of Using Excelmatic for Sales Data Insights
Switching to Excelmatic offers game-changing advantages:
- Time-Saving: Turn hours of manual work into seconds of AI-driven results.
- Accuracy: AI eliminates human error, ensuring your numbers are spot-on.
- Ease of Use: No need to master VLOOKUP or SUMIFS—just ask questions naturally.
- Scalability: Handle datasets with thousands of rows without breaking a sweat.
- Visual Power: Generate charts and graphs to spot trends or impress stakeholders.
For businesses, this means faster decisions, fewer mistakes, and empowered teams—no matter their Excel expertise.
Real-World Applications: Who Benefits from Excelmatic?
Excelmatic’s versatility makes it a must-have for various roles:
- Sales Teams: Track YTD performance by rep, region, or fruit type without manual calculations. Example: "Which rep sold the most apples in Italy this year?"
- Small Businesses: Forecast inventory needs based on sales trends. Example: "How many oranges will I need in Spain next quarter?"
- Managers: Prepare polished reports for stakeholders in minutes, not days.
- Marketers: Analyze campaign data tied to sales—e.g., "Did apple sales spike in France after our latest ad?"
How to Get Started with Excelmatic: A Step-by-Step Guide
Ready to experience this AI-powered Excel tool? Here’s how to analyze your fruit sales dataset with Excelmatic:
- Prepare Your Data: Ensure your Excel file has clear headers like "Sales Rep," "Fruit," "Region," "Date," and "Sales." Messy data? Excelmatic’s AI can often handle it anyway.
- Upload to Excelmatic: Visit excelmatic.ai, sign up for free, and upload your file.
- Ask Away: In the chatbox, try questions like:
- "How many apples were sold in Germany from Oct’24 to Mar’25?"
- "What’s the monthly sales trend for oranges in Spain?"
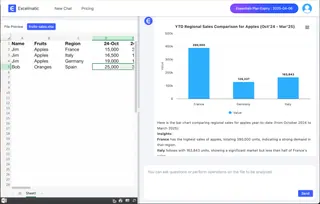
- "Which region sold the most fruit overall?"
- Visualize and Share: Click to generate charts—say, a line graph of monthly apple sales—and export them as PDFs or images for your next meeting.
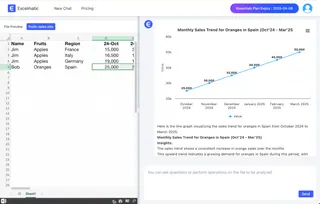
You can open this link to view how this works: Simplifying Excel Sales Data Analysis with Excelmatic Demo
FAQs:
Q: Is Excelmatic secure for sensitive sales data?
A: Absolutely. Excelmatic uses top-tier encryption and doesn’t store your files after analysis.
Q: Can it handle large datasets?
A: Yes—it’s designed for spreadsheets with thousands of rows and complex structures.
Q: What if I need support?
A: Excelmatic offers 24/7 live chat to help you troubleshoot or maximize the tool.
Conclusion: Revolutionize Your Excel Data Analysis
Manual Excel analysis is a relic of the past—time-consuming, error-prone, and inaccessible to many. With Excelmatic, you can:
- Upload your data in seconds.
- Ask questions in plain language for instant sales data insights.
- Turn raw numbers into actionable strategies with ease.
Whether you’re tracking fruit sales across Europe or digging into your own business data, Excelmatic makes easy Excel analysis a reality for everyone. Ready to ditch the formulas and embrace the future?
Start your free trial of Excelmatic today, or watch our video tutorial for a visual guide. Share this post with anyone who’s tired of spreadsheet struggles—let’s spread the word about this game-changing tool!


