Key Takeaways
- Business professionals spend too much time on manual data tasks—formatting tables, writing complex formulas, and creating charts—which slows down decision-making.
- Excelmatic uses AI to automate the entire data analysis process. You simply upload your spreadsheet and ask questions in plain English to get instant answers, calculations, and visualizations.
- This AI-powered approach requires no Excel expertise, transforming a multi-step manual process into a conversational experience and delivering insights in seconds instead of minutes or hours.
- For rapid, user-friendly analysis and reporting, Excelmatic is a game-changer that complements the in-spreadsheet organization provided by traditional Excel Tables.
Whether you're in marketing, sales, or operations, Excel is an indispensable part of your toolkit. This popular spreadsheet software allows us to insert, read, and manipulate data in rows and columns, making it a cornerstone of businesses of all sizes.
Despite its worldwide popularity, many users aren't fully leveraging one of its most powerful features: Excel Tables. These are often confused with PivotTables, but they serve a more fundamental purpose.
In this article, we'll cover the basics of Excel tables, showcasing their features and benefits. But we'll also go a step further. We'll compare the traditional way of working with tables to a modern, AI-powered approach using tools like Excelmatic. You'll see how you can achieve the same results—and often more—with significantly less effort.
What Is an Excel Table?
By default, data entered into an Excel sheet is just a loose collection of information in cells. The cells are related only by their proximity to one another.
By contrast, an Excel Table turns a range of cells into a structured, cohesive group of data. First launched in Excel 2007, this feature provides an easy way to organize your data, making preparation and analysis far more efficient. It offers an intuitive layout and a wide array of capabilities, such as sorting, filtering, and auto-filling formulas.
An Excel table has two key elements, with an optional third one:
- Header Row: The first row of the table, containing unique, non-blank headings that identify each column.
- Body: The main part of the table where all your data and formulas reside.
- Total Row (Optional): An extra row at the end of the table for summarizing data. It provides a dropdown with functions like
SUM(),AVERAGE(), etc.
Below is an example of a simple Excel table. It's organized, but it still required manual steps to create.

Modern AI tools like Excelmatic, however, automatically interpret your data as a structured table the moment you upload it, eliminating the need for manual setup.
How to Create, Remove, and Manage Tables
Let's look at the basic commands for managing tables, comparing the traditional method with a streamlined AI approach.
How to Make a Table in Excel: The Traditional Way
Creating a table is fairly easy. Select the cell or range you want to convert, and then do one of the following:
Insert > TableHome > Format as Table
Excel will auto-detect your data range and headers. If you choose "Format as Table," you can also select a visual style.
You can also name your table via the Table Design tab. Naming tables (e.g., Sample) makes formulas easier to write and manage.

To remove a table structure, select it and click Table Design > Convert to Range. The formatting will remain, but the table functionality will be gone.
The AI-Powered Way: Instant Analysis with Excelmatic
With an AI agent like Excelmatic, there is no "create table" step.

You simply upload your Excel file and Excelmatic instantly recognizes it as a structured dataset. There's no need to select ranges, click menus, or name your table. Your data is immediately ready for analysis. This approach skips the manual setup and gets you straight to the insights.
Key Features: Manual vs. AI
Let’s explore the key functionalities of tables and see how an AI approach revolutionizes the workflow. We'll use an expanded sales dataset for the following examples.
Filtering and Sorting
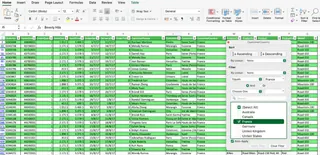
The Traditional Way: Excel tables include built-in filter arrows in the header row. You can click these to open a dropdown menu and select the data you want to see. For example, to find customers in France, you would click the filter on the "Country" column and select "France."

For more interactive filtering, you can insert Slicers from the Table Design tab, which provide clickable buttons.

The AI Way (Excelmatic): Instead of clicking through menus, you just ask a question in plain English.
Show me all sales from France. Sort the data by Profit in descending order.
Excelmatic delivers the filtered or sorted data instantly. It's conversational, intuitive, and much faster.
Calculated Columns
The Traditional Way:
Excel tables automatically apply a formula to an entire column. For example, to create a Profit column, you would type the formula = [ItemPrice] - [ItemCost] in the first cell, and it would auto-fill down the column.
This uses structured references ([@ColumnName]), which are easier to read than cell references like E2-D2.
The AI Way (Excelmatic): Forget formula syntax. Just tell Excelmatic what you want.
Create a new column named 'Profit' by subtracting ItemCost from ItemPrice.
The AI handles the calculation across the entire dataset for you. This is a game-changer for users who aren't comfortable writing formulas.
Summarizing Data with the Total Row
The Traditional Way:
You can activate a Total Row in the Table Design tab. This adds a row at the bottom where you can use a dropdown to select summary functions like SUM, AVERAGE, or COUNT. The calculations automatically adjust when you filter the data.
The AI Way (Excelmatic): You get answers directly, without adding rows to your table. Just ask:
What is the total profit for all sales?
What is the average ItemPrice in Germany?
How many orders were placed in the United States?
Excelmatic provides the specific number you need, which is perfect for fast reporting and analysis.
Compatibility with Charts and PivotTables
The Traditional Way:
Excel Tables are excellent data sources for Charts and PivotTables. When you add new data to your table, any associated chart or PivotTable can be refreshed to include it. However, creating them still involves multiple steps through the Insert menu and PivotTable Fields pane.
The AI Way (Excelmatic): This is where AI truly shines. You can generate complex visualizations with a single sentence.
Create a bar chart showing total sales by country. Generate a pie chart of sales by product category.
Excelmatic instantly creates the chart for you, completely bypassing the manual PivotTable and chart creation process. This transforms a multi-minute task into a matter of seconds.
Other Table Features
- Automatic Expansion: In Excel, tables automatically expand to include new rows or columns you add next to them. In Excelmatic, you simply upload the updated file, and the AI re-analyzes the entire dataset instantly.
- Data Validation: Excel tables can use data validation rules to control data entry (e.g., restricting a column to a list of countries). This is a feature for controlling manual data input within the spreadsheet. Excelmatic focuses on analyzing existing data, though it can also help with data cleaning by identifying and correcting inconsistencies.
- Table Styles: Excel offers many visual styles for tables. Excelmatic focuses on the output—the analysis, the charts, the insights—rather than the cosmetic formatting of the raw data grid.
Excel Tables vs. Excelmatic: A Head-to-Head Comparison
| Feature / Task | Excel Tables (Manual Method) | Excelmatic (AI Method) |
|---|---|---|
| Data Setup | Manual: Insert > Table, name the table. |
Automatic: Upload the file, and it's ready. |
| Filtering Data | Click dropdown arrows, select values. | Ask in plain language: "Show me sales in Canada." |
| Creating New Columns | Write a formula with structured references. | Describe the calculation: "Create a profit column." |
| Summarizing Data | Add a Total Row and select functions. |
Ask for the specific value: "What is the total profit?" |
| Creating Charts | Multi-step process: Insert PivotTable, configure fields, insert chart. | Single step: "Chart the sales by country." |
| Learning Curve | Moderate: Requires knowing menus, formulas, and concepts. | Minimal: If you can ask a question, you can use it. |
| Best For | Structuring and organizing data within a live spreadsheet. | Rapid analysis, reporting, and visualization from a spreadsheet. |
Conclusion
Excel Tables are a fundamental and powerful feature for anyone serious about organizing their data within a spreadsheet. They bring structure, clarity, and dynamic capabilities that are a huge step up from working with plain cell ranges. Mastering them is a valuable skill.
However, the landscape of data analysis is evolving. AI-powered tools like Excelmatic represent the next leap forward. They handle the structuring automatically and allow you to query, analyze, and visualize your data using natural language. This not only dramatically speeds up the workflow but also makes sophisticated data analysis accessible to everyone, regardless of their Excel expertise.
For in-sheet organization and collaborative editing, traditional Excel Tables remain essential. But for turning that data into fast, accurate reports and insights, an AI agent is the smarter, more efficient choice.
Ready to experience the future of data analysis? Try Excelmatic today and see how you can go from data to insights in seconds, with no complex formulas required.
Excel FAQs
What are Excel Tables?
An Excel Table is a named range of data that provides structure and special features like built-in filtering, automated formula filling, and dynamic resizing. AI analysis tools like Excelmatic automatically treat data as a structured table without manual setup.
When should you use Excel tables?
Use traditional Excel Tables when you need to organize data for ongoing manual entry and collaboration directly within the spreadsheet. For rapid analysis, chart generation, and reporting from a static dataset, consider an AI tool like Excelmatic for a faster workflow.
What is the difference between an Excel table and a What-If Analysis data table?
An Excel Table organizes a range of related data. A What-If Analysis data table is a specific tool used to see how changing one or two variables in a formula affects the results.
What is a structured reference?
In an Excel Table, a structured reference uses table and column names in formulas (e.g., Sales[Profit]) instead of cell addresses (e.g., C2:C100). AI tools like Excelmatic bypass this need by allowing you to refer to columns by name in plain language.
What are the main limitations of Excel tables?
Traditional Excel Tables can experience performance issues with very large datasets (over 100,000 rows) and are not supported in older shared workbooks. Their functionality also requires learning specific Excel menus and formula syntax, a hurdle that AI tools like Excelmatic eliminate by letting you analyze data through simple conversations.


